

 Português pt
 Español es
 العربية ar
 বাংলা bn
 Deutsch de
 Filipino fil
 Français fr
 हिन्दी hi
 Bahasa Indonesia id
 Italiano it
 Русский ru
 Svenska sv
 ไทย th
 Türkçe tr
 Tiếng Việt vi
 简体中文 zh
Updated:
Indicators5 Popular Indicators Explained in 5 Minutes (Part 1)
 Naomi TanakaEditorial character · Analysis Desk

Quick answer
The five most popular technical indicators are the moving average (direction), the RSI (strength and excess), the MACD (change in pace), Bollinger Bands (volatility) and the Stochastic (the price's position within its recent range). They work best combined, one for each question, and all of them generate false signals when used alone.
There are hundreds of technical indicators, but most traders use a small handful. Understanding those few well pays off more than collecting dozens without knowing what they're for. In this first part, we cover the five most popular: moving average, RSI, MACD, Bollinger Bands and Stochastic. The second part covers volume, ATR, Fibonacci, Ichimoku and OBV.
For each one, we show what it measures and what it actually showed on the Ibovespa, using real daily quotes (Yahoo Finance) between April and October 2026.
What each indicator measures
1. Moving average
It's the average of the last N closes, recalculated with every candle. It shows the overall direction: price above a rising average signals an uptrend; below a falling average, a downtrend. The 20-period tracks the short term; the 50-period, the medium term; the 200-period, the long term.
2. RSI (Relative Strength Index)
Compares the average of gains with the average of losses over the last 14 periods, on a scale of 0 to 100. Above 70 signals overbought; below 30, oversold. It shows the strength of the move, not the exact turning point.
3. MACD
It's the difference between the 12- and 26-period exponential moving averages, with a signal line (a 9-period average of the MACD itself). The MACD crossing above the signal line signals the pace is turning bullish; below, bearish.
4. Bollinger Bands
A 20-period average with two bands set two standard deviations away. Narrow bands show a calm market; wide bands, an agitated one. A strong squeeze of the bands often precedes a big move, without telling you the direction.
5. Stochastic
Shows where the close sits within the range between the high and low of the last 14 periods, from 0 to 100. Above 80, the price closes near recent highs; below 20, near recent lows. It reacts faster than the RSI and so generates more signals, including false ones.

Real example: the Ibovespa in 2026
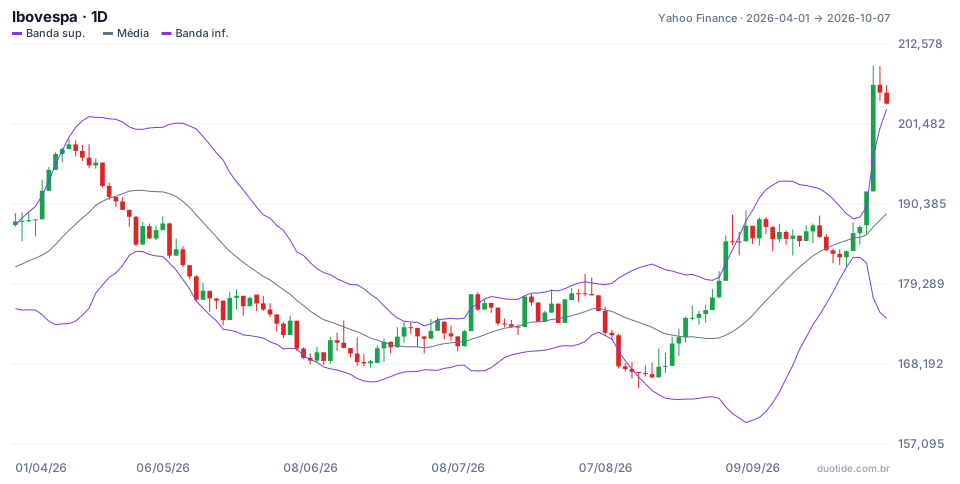
The chart shows the Ibovespa with the 20-period Bollinger Bands. The index closed at 187,953 points on April 1, 2026 and at 204,302 on October 7, up 8.7%, with a drop to a low of 164,835 on August 14 in between. Each indicator told part of the story:
50-period average: direction, and July's back-and-forth
From May 7 to July 9, the Ibovespa closed every day below the 50-period average; on June 1, for instance, it was at 172,198 points with the average at 184,833. In July, however, the index crossed the average five times in eight sessions (July 10, 16, 17, 20 and 21). In a directionless market, the moving average generates signals that cancel each other out.
Stochastic: oversold that lasted
On August 7, the Stochastic's %K fell to 4.5 with the index at 172,513. Anyone who bought there on the oversold signal watched the Ibovespa fall a further 3.6%, to 166,335 on August 18. The %K stayed below 20 for more than a week.
MACD: one hit and one miss
On August 25, the MACD crossed above the signal line with the index at 174,577; ten sessions later it was at 185,629, up 6.3%. On September 22 it crossed below at 187,423, and ten sessions later the index was at 205,835, 9.8% higher. The same signal was right once and wrong the other time.
RSI: overbought with no drop
On September 8, the RSI reached 79.3 with the index at 187,367. The biggest closing pullback in the following weeks was to 182,991 on September 28, and in October the index passed 200,000 points.
Bollinger: the squeeze before the explosion
On September 30, the gap between the bands fell to 2.91% of the average, the smallest in the window. On October 5, the Ibovespa rose 7.7% in a single session, from 192,115 to 206,912 points, closing well above the upper band. From the close of September 30 (186,340) to October 5, the gain was 11.0%.
These cases describe what happened, not what's going to happen.
How to use the five indicators together
Different speeds
Moving average and MACD are slow and confirm moves already underway. RSI and Stochastic are fast and show excesses. Bollinger shows the state of volatility. That's why it's normal for them to disagree on the same day.
A common combination
Use the moving average for direction, an oscillator (RSI or Stochastic, not both) for the entry point within that direction, and the MACD or the Bollinger Bands to confirm momentum.
Chart timeframe
The default parameters (20, 14, 12/26/9) were designed to work on any timeframe, but the reading changes. On the daily chart, a MACD crossover can take weeks to confirm; on the 5-minute chart, several show up per day. Before trading on a short timeframe, check what the same indicators show on the daily chart: the bigger timeframe's direction usually carries more weight.
Limitations
All five are calculated from past price. They lag during sharp reversals, know nothing about news, and generate false signals in a sideways market, like the 50-period average in July.

Common mistakes with the classic indicators
- Buying just because the Stochastic or RSI entered oversold, without checking the direction.
- Using RSI and Stochastic together thinking one confirms the other: the two measure almost the same thing.
- Treating a Bollinger Bands squeeze as a bullish signal: it signals a move, not a direction.
- Following every moving-average crossover in a sideways market.
- Changing parameters after every wrong signal.
On a demo account, add one indicator at a time to the chart of the asset you follow and, for a few weeks, note every signal and what the price did in the following days. Only then combine two or three. The record shows more about each indicator than any definition.
Practice before you risk. Open your Duotide account and test your ideas on the demo account with US$10,000 in virtual funds.
Create free accountUpdated:
Editorial character of the Duotide newsroom. Articles are written by the team with the help of artificial intelligence; prices and charts come from real market data. Explains charts, indicators and trading strategies: how they work, where they fail and how to test them first.
Was this article helpful?
Be the first to rate it.
Comments
- No comments yet. Be the first to comment.
Ready to put it into practice?
Open your account and practice on the demo account with US$10,000 in virtual funds, without risking money.
- Secure platformProtected login and identity verification
- Multilingual supportHelp available every day
- Free demo accountUS$10,000 virtual to practice
Trading involves the risk of losing the capital invested.
