

 Português pt
 Español es
 العربية ar
 বাংলা bn
 Deutsch de
 Filipino fil
 Français fr
 हिन्दी hi
 Bahasa Indonesia id
 Italiano it
 Русский ru
 Svenska sv
 ไทย th
 Türkçe tr
 Tiếng Việt vi
 简体中文 zh
Updated:
Indicators5 Popular Indicators Explained in 5 Minutes (Part 2)
 Naomi TanakaEditorial character · Analysis Desk

Quick answer
Volume, ATR, Fibonacci, Ichimoku and OBV complement the classic indicators: volume and OBV show whether there's real participation behind the move, the ATR measures how far the price typically travels, Fibonacci marks correction levels, and Ichimoku sums up trend and support in a cloud. None of them predicts the price; they serve to confirm or question other signals.
In the first part of this guide we covered moving average, RSI, MACD, Bollinger Bands and Stochastic. They answer well where the price is heading and with how much strength, but they leave out three important questions: how much money is behind the move, how much the price typically travels, and where it tends to run into barriers.
This second part covers five tools that fill those gaps: volume, ATR, Fibonacci, Ichimoku and OBV. For each one, we show what it showed on bitcoin (BTC/USDT on Binance), using real daily quotes between April and October 2026.
What each indicator measures
1. Volume
It's the amount traded in each candle. It serves to confirm moves: a breakout with volume well above average has more participation than the same breakout with weak volume. A simple measure is dividing the day's volume by the average of the last 20 days.
2. ATR (Average True Range)
Measures the average range of movement per candle over the last 14 periods, without indicating direction. It's used to size stops and positions: a stop smaller than the ATR tends to get hit by the price's normal back-and-forth.
3. Fibonacci retracement
Draws levels at 23.6%, 38.2%, 50% and 61.8% between a low and a high. The idea is that, during a correction, the price tends to react near those levels. The math is simple: level = high − percentage × (high − low).
4. Ichimoku
It's a system made of several lines. The main ones are the tenkan-sen (midpoint of the last 9 periods' range), the kijun-sen (midpoint of the last 26 periods' range) and the cloud, drawn 26 periods ahead. Price above the cloud signals a bullish bias; below, bearish; inside, indecision.
5. OBV (On-Balance Volume)
Adds the volume of up days and subtracts that of down days, forming a cumulative line. The absolute value doesn't matter; the direction does. The most common use is looking for divergences between the OBV and the price.

Real example: bitcoin with OBV in 2026
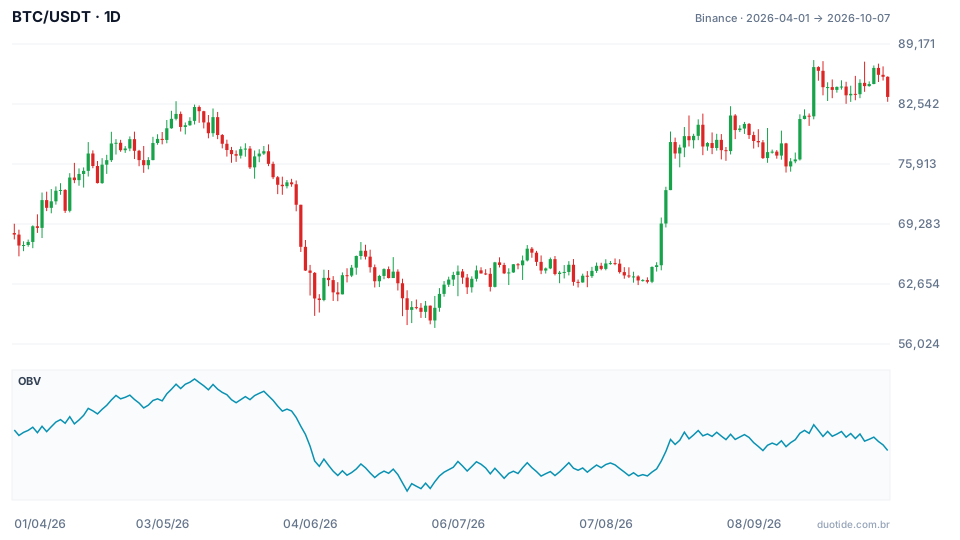
BTC closed at $68,113.92 on April 1, 2026 and at $83,321.81 on October 7, up 22.3%. The period's low was $57,800.19 on July 1 and the high, $87,395.67 on September 21. Here's what each tool showed:
Volume confirming August's turn
On August 19, BTC closed at $69,334.79, up 7.1% on the day, with volume 2.41 times the 20-day average. On August 21, already at $78,338.03, volume was 3.02 times the average. The rally came with growing participation, not with a few isolated trades.
ATR: volatility shifted more than twice
The 14-day ATR went from $2,685.82 on April 2 to $1,226.13 on August 16 and ended at $2,187.23 on October 7. With a stop rule of 1.5 × ATR, the stop on October 7 would sit about $3,281 from the entry price. In mid-August, the same rule would give less than half that.
Fibonacci: the correction was shallow
Between the low of July 1 ($57,800.19) and the high of September 21 ($87,395.67), the rally was $29,595.48. The retracement levels sit at $80,411.14 (23.6%), $76,090.20 (38.2%), $72,597.93 (50%) and $69,105.66 (61.8%). Through October 7, the lowest low after the top was $82,563, on September 28: the price didn't even reach the first level. Fibonacci levels mark where to look, not where the price will stop.
Ichimoku: from well below to above the cloud
On June 25, BTC closed at $59,794, well below the cloud, which sat near $76,500. The first close above the cloud after that came on August 18, at $64,725.42, one day before August 19's strong rally. On October 7, the price ($83,321.81) was still above the cloud, whose edges stood at $75,849 and $72,288.
OBV: divergence at the top
On September 21, BTC closed at $86,620, above the close of May 10 ($82,210.07). The OBV, however, was lower than on May 10. Price at a higher high with OBV at a lower high is a bearish divergence: the rally had less cumulative volume behind it. Through October 7, BTC pulled back 3.8% from September 21.
These cases describe what happened, not what's going to happen.
How to combine both parts of the guide
Direction and entry from part 1
Use moving average, MACD or RSI to define the direction and the entry's timing.
Quality and risk from part 2
Use volume and OBV to check whether there's real participation, the ATR to set the stop and position size, and Fibonacci and the Ichimoku cloud to map out where a correction would still be normal.
Limitations
Volume in crypto varies between exchanges, so what matters is the volume from the source you're looking at. Fibonacci levels depend on which low and which high you pick. Ichimoku has many lines and can confuse beginners. All of them are calculated from past data.

Common mistakes with volume, ATR, Fibonacci, Ichimoku and OBV
- Treating every breakout the same, without comparing volume to the average.
- Using a fixed dollar stop without looking at the current ATR.
- Picking the Fibonacci low and high after seeing where the price reacted.
- Buying just because the price touched a Fibonacci level.
- Reading the OBV's absolute value instead of the line's direction.
- Using the full Ichimoku without understanding each line.
On a demo account, add one tool at a time to the chart and record, for a few weeks, what it showed and what the price did afterward. Start with the ATR, which already helps size the risk of any trade.
Practice before you risk. Open your Duotide account and test your ideas on the demo account with US$10,000 in virtual funds.
Create free accountUpdated:
Editorial character of the Duotide newsroom. Articles are written by the team with the help of artificial intelligence; prices and charts come from real market data. Explains charts, indicators and trading strategies: how they work, where they fail and how to test them first.
Was this article helpful?
Be the first to rate it.
Comments
- No comments yet. Be the first to comment.
Ready to put it into practice?
Open your account and practice on the demo account with US$10,000 in virtual funds, without risking money.
- Secure platformProtected login and identity verification
- Multilingual supportHelp available every day
- Free demo accountUS$10,000 virtual to practice
Trading involves the risk of losing the capital invested.
