

 Português pt
 Español es
 العربية ar
 বাংলা bn
 Deutsch de
 Filipino fil
 Français fr
 हिन्दी hi
 Bahasa Indonesia id
 Italiano it
 Русский ru
 Svenska sv
 ไทย th
 Türkçe tr
 Tiếng Việt vi
 简体中文 zh
Updated:
Risk managementRisk management in trading: 5 tips to avoid losing it all
 Camila NascimentoEditorial character · Risk & Behavior Desk

Quick answer
The five basic risk management practices are: decide in advance how much to risk per trade (generally 1% to 2% of the account), use a stop without moving it, calculate the risk-reward ratio, diversify across assets and times, and log everything in a journal. Position size should come from the stop's distance, not a fixed amount: with the ATR, the dollar risk stays the same even when volatility changes.
Risk management is the topic most beginners skip, in a rush to get to the part about picking the right trade. The problem is that no win rate survives for long without clear rules for how much to risk, when to stop, and how to react to a losing streak.
The five practices below don't guarantee profit; no practice does. They reduce the chance that a bad streak wipes out the account. So the numbers aren't abstract, we calculated position size using bitcoin's real volatility (BTC/USDT on Binance) between April and October 2026.
What risk management in trading is
It's the set of rules that defines how much you can lose on each trade, each day, and overall, before you open any position. It doesn't choose the entry; it decides the size of the bet and the exit point when the analysis turns out wrong. An average strategy with good risk management tends to last longer than a good strategy without it.
The 5 risk management tips
1. Set the risk per trade beforehand, not in the moment
A common rule is to risk between 1% and 2% of the account per trade. With US$ 10,000, that means losing at most US$ 100 to US$ 200 if the stop is hit. Setting that number while the market is closed avoids deciding under the pressure of a moving chart.
2. Treat the stop as a rule, not a suggestion
The stop is the order that closes a losing position at a defined limit. The most common trap is moving it farther away to give the trade more room, which turns a small, planned loss into a large, unplanned one.
3. Calculate the risk-reward ratio before entering
If you risk US$ 50 to make US$ 40, you need to win more than 55.6% of the time just to break even (50 ÷ 90). If you risk US$ 50 to make US$ 75, breakeven drops to 40% (50 ÷ 125). Compare that number with your strategy's real win rate, measured on past trades.
4. Diversify assets and times
Concentrating all trades in a single asset and the same time window exposes the account to a single event. Spreading trades across loosely related assets, such as a currency pair and a commodity, keeps every loss from happening for the same reason.
5. Log every trade in a journal
Asset, time, amount risked, result, and reason for the entry. After 20 or 30 entries, it becomes clear whether the win rate is sustainable, and patterns of error show up, such as trading more after a loss.
How to calculate position size with the ATR
The right size isn't a fixed dollar amount; it depends on how far away the stop is. A common way to measure that distance is the 14-day ATR (average true range), which shows how much the price moves, on average, per day.
- Dollar risk: 1% of US$ 10,000 = US$ 100.
- Stop distance: 2 × ATR.
- Size: US$ 100 ÷ stop distance.
On October 7, 2026, bitcoin's ATR was US$ 2,187.23, with the price at US$ 83,321.81. The stop would sit at US$ 4,374.46 (5.25% of the price), and the size would be 100 ÷ 4,374.46 = 0.02286 BTC, about US$ 1,904.74 of position. Notice: risking 1% of the account doesn't mean buying 1% of the account in bitcoin.

Real example: bitcoin's ATR in 2026
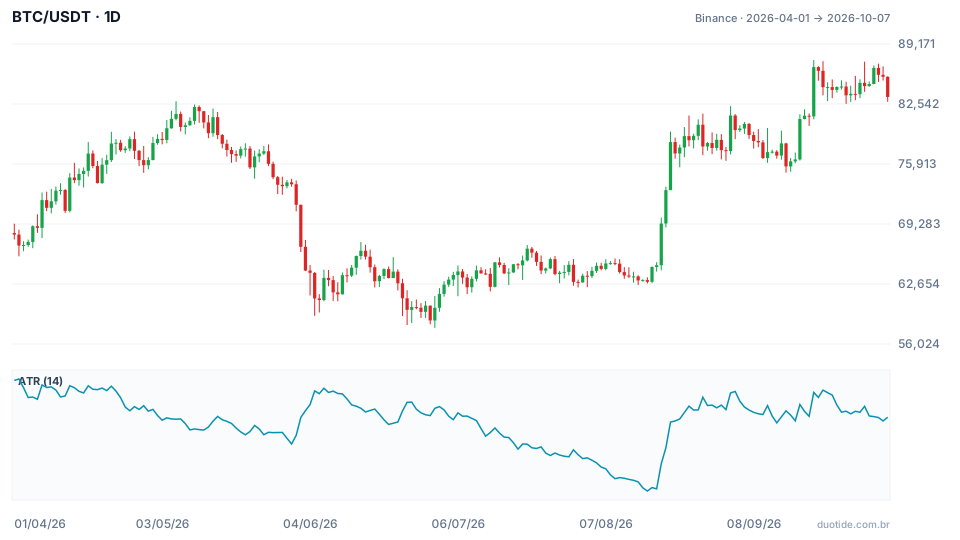
The chart shows BTC/USDT from April 1, 2026 to October 7, 2026, with the 14-day ATR in the panel below. Over the period, the price rose 22.33%, with a low of US$ 57,800.19 on July 1 and a high of US$ 87,395.67 on September 21. Volatility changed a lot, and position size would have had to change along with it.
April: ATR at its highest, smaller position
On April 2 the ATR reached US$ 2,685.82, the highest in the period, with the price at US$ 66,901.99. Under the same rule, the stop would sit at US$ 5,371.65 (8.03% of the price), at US$ 61,530.34, and the position would be 0.01862 BTC, about US$ 1,245.47. That stop was hit on June 4, when the day's low reached US$ 61,383.56. The loss would come close to the planned US$ 100, while the price kept falling to US$ 57,800.19 on July 1.
August: ATR at its lowest, larger position
On August 16 the ATR stood at US$ 1,226.13, the lowest in the period, with the price at US$ 62,900.00. The stop would sit at US$ 2,452.26 (3.90% of the price), and the position would rise to 0.04078 BTC, about US$ 2,564.98. The dollar risk is the same in all three cases: US$ 100. The examples describe what happened, not what will happen.
How to apply all five practices together
Define what ends your day
Write it down beforehand: the day ends when you hit the loss limit (say, 3% of the account), when you complete a fixed number of trades, or when you reach the target, whichever comes first. After that, the platform closes.
Recalculate the size for every trade
Account balance and volatility change. Redo the size calculation with the current balance and the day's ATR; don't reuse the previous trade's size.
Limitations
The stop can be executed at a worse price than planned during sharp moves or while the market is closed, and the real loss exceeds what was planned. The ATR is calculated from the past and reacts with a lag. And no risk rule turns a strategy with a negative expected result into a positive one.
Common mistakes in risk management
- Doubling the size after a loss to recover quickly.
- Treating the 1% to 2% limit as flexible on days of high confidence.
- Using the same position size when volatility doubles.
- Confusing position value with value at risk.
- Stopping the journal because the last few results were good.
- Moving the stop farther away as the price approaches it.
To practice, use a demo account for a few weeks with a fixed risk rule per trade and calculate each position's size using the day's ATR. Log the planned risk, the real loss or gain, and the reason for the entry. Comparing what was planned with what actually happened is what shows whether your risk management exists in practice or only on paper.
Practice before you risk. Open your Duotide account and test your ideas on the demo account with US$10,000 in virtual funds.
Create free accountUpdated:
Editorial character of the Duotide newsroom. Articles are written by the team with the help of artificial intelligence; prices and charts come from real market data. Writes about risk management, position sizing and the psychology behind traders' decisions.
Was this article helpful?
Be the first to rate it.
Comments
- No comments yet. Be the first to comment.
Ready to put it into practice?
Open your account and practice on the demo account with US$10,000 in virtual funds, without risking money.
- Secure platformProtected login and identity verification
- Multilingual supportHelp available every day
- Free demo accountUS$10,000 virtual to practice
Trading involves the risk of losing the capital invested.
