

 Português pt
 Español es
 العربية ar
 বাংলা bn
 Deutsch de
 Filipino fil
 Français fr
 हिन्दी hi
 Bahasa Indonesia id
 Italiano it
 Русский ru
 Svenska sv
 ไทย th
 Türkçe tr
 Tiếng Việt vi
 简体中文 zh
Updated:
IndicatorsADX: What It Is, How to Calculate It and Read Trend Strength
 Naomi TanakaEditorial character · Analysis Desk

Quick answer
The ADX (Average Directional Index) is an indicator created by J. Welles Wilder that measures the strength of a trend on a scale of 0 to 100, without indicating direction. Below 20 the market tends to have no trend; above 25, the trend has strength. Direction comes from the DI+ and DI− lines: DI+ above indicates a bullish bias, DI− above indicates a bearish bias.
One of the most expensive mistakes in technical analysis is applying a trend-following strategy in a market that's moving sideways: entry after entry, stop after stop, with no clear direction. The ADX was created exactly to tell these two situations apart. It doesn't say whether price will rise or fall; it says whether a trend is strong enough to be worth following.
In this guide we use gold's real daily quotes (futures contract GC=F, Yahoo Finance data) between March and October 2026, a period with two sharp drops, a solid rally and long sideways stretches. It's a good laboratory for seeing what the ADX shows, and where it arrives late.
What the ADX is
The ADX (Average Directional Index) was introduced by J. Welles Wilder in 1978, in the same book that brought the RSI and the ATR. It's part of a system with three lines:
- DI+ (positive directional indicator): measures the strength of upward moves.
- DI− (negative directional indicator): measures the strength of downward moves.
- ADX: a smoothed average of the gap between DI+ and DI−. It ranges from 0 to 100, but in practice it rarely goes above 50 or 60.
The key point is that the ADX rises both in a strong uptrend and in a strong downtrend. The direction is told by where DI+ sits relative to DI−; the ADX only tells you the intensity. The standard period is 14 candles.

How to calculate the ADX
The calculation has more steps than other indicators, but each one is simple:
- Directional movement: +DM is today's high minus yesterday's high; −DM is yesterday's low minus today's low. Only the larger of the two counts, and only if it's positive; the other becomes zero.
- True range (TR): the largest value among today's high minus low, high minus the previous close, and the previous close minus today's low (as an absolute value).
- Wilder smoothing: +DM, −DM and TR are smoothed over 14 periods. DI+ = 100 × (smoothed +DM ÷ smoothed TR) and DI− = 100 × (smoothed −DM ÷ smoothed TR).
- DX = 100 × |DI+ − DI−| ÷ (DI+ + DI−), and the ADX is the smoothed average of the DX: new ADX = (previous ADX × 13 + today's DX) ÷ 14.
Example with real gold data
On August 4, 2026, gold had a high of US$ 4,163.80, a low of US$ 4,098.20, and closed at US$ 4,152.60. The next day, August 5, the high was US$ 4,328.20, the low US$ 4,121.60, and the close US$ 4,305.20.
- +DM = 4,328.20 − 4,163.80 = 164.40. The low rose (from 4,098.20 to 4,121.60), so −DM = 0.
- TR = 4,328.20 − 4,121.60 = 206.60, larger than the other two distances (175.60 and 31.00).
- After smoothing, the day's DI+ came out to 27.35 and the DI− to 15.76.
- DX = 100 × (27.35 − 15.76) ÷ (27.35 + 15.76) = 100 × 11.59 ÷ 43.11 = 26.88.
- ADX = (24.16 × 13 + 26.88) ÷ 14 = 340.96 ÷ 14 = 24.35, which the platform shows as 24.36 due to rounding on the lines.
Notice the detail: in a single day with a 3.7% rally, DI+ jumped and overtook DI−, but the ADX barely moved (from 24.16 to 24.36). The double smoothing makes the ADX react slowly. That's what makes it stable, and it's also why it lags.
Real example: gold's ADX in 2026
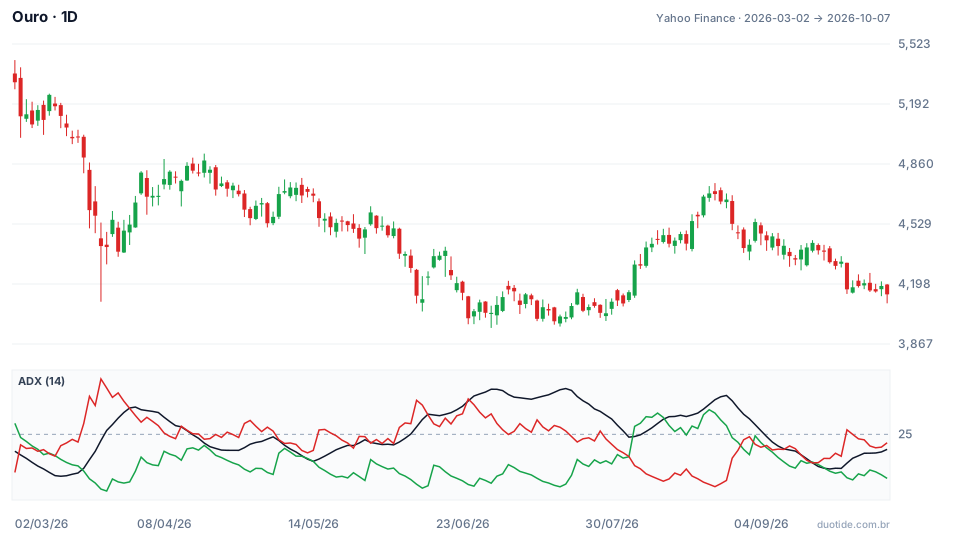
In the chart, the black line is the ADX, the green one is DI+, and the red one is DI−; the reference line marks the 25 level. Three stretches show the indicator's behavior clearly.
March: the ADX confirmed the drop after it had already run
On March 12, 2026, the ADX stood at 12.63, the period's lowest reading, with gold at US$ 5,125.80: a market with no trend. Starting March 18, DI− spiked and reached 41.34 on March 23. The ADX only crossed above 25 on March 24 (26.15), with gold already at US$ 4,402.00, 14.1% below the March 12 close. Anyone who waited for the ADX above 25 to confirm the drop only caught the tail end of it; gold bounced back to US$ 4,813.10 on April 1.
June and July: ADX high just as the move was losing steam
On June 9 the ADX crossed above 25 again (25.09), with DI− at 28.14 and DI+ at 11.65, and gold at US$ 4,286.40. This time the confirmation came in time: the drop continued to the period's low, US$ 3,955.40, on June 30, down 7.7%. The ADX, however, kept rising and only peaked at 38.51 on July 20, with gold at US$ 4,015.90 and the price already moving sideways between US$ 3,990 and US$ 4,170 for three weeks. The ADX's peak marked the end of the drop's strength, not the start of more decline.
August: DI+ crosses over, ADX confirms, and the rally develops
On August 5, DI+ crossed above DI− (27.35 versus 15.76). On August 7 the ADX crossed above 25 (25.84) with gold at US$ 4,399.70. The rally continued to US$ 4,697.80 on August 24, up 6.8%, and the ADX reached 36.47 on August 27. From then on it fell without stopping: on September 1, DI− moved back above DI+, and on September 23 the ADX was at 14.77, after two weeks of closes between US$ 4,318.40 and US$ 4,460.70. It closed October 7 at US$ 4,140.70, with the ADX at 20.57.

How to use the ADX
As a filter before any strategy
The most useful way to use the ADX is to decide which type of strategy makes sense. With the ADX below 20, as with gold in mid-March and in the second half of September, breakout and moving-average-crossover strategies tend to generate false signals. Above 25, they have a better chance of working, and mean-reversion strategies (buying at support, selling at the resistance of a channel) become riskier.
Reference levels
- Below 20: weak or absent trend.
- Between 20 and 25: transition zone, without consolidated strength.
- Above 25: trend with strength.
- Above 40: very strong trend, and often closer to exhaustion than to its start.
These numbers are conventions, not laws. More volatile assets can have the ADX above 25 often; on calmer assets, 20 can already be plenty.
DI+ and DI− for direction
With DI+ above DI−, the bias is bullish; with DI− above, bearish. The crossover between the two lines is a signal worth noting, and it carries more weight when it happens with the ADX rising, as in August. Crossovers with the ADX falling and below 20, like the several in September, tend to be noise.
The slope matters more than the level
ADX rising means the trend is gaining strength; ADX falling means it's losing strength, even if the value is still above 25. In July, gold's ADX was above 35, but falling, and the price had already stopped dropping.
Limitations
The ADX uses two layers of smoothing and therefore lags: it confirms trends after a good part of the move has already happened, as in March. It also doesn't anticipate reversals or account for news, and a peak in the ADX doesn't tell you when the trend will end. Use it together with support and resistance, volume and a stop rule defined before entry.
Common mistakes when using the ADX
- Thinking ADX rising means price rising: the ADX also rises in sharp downtrends.
- Buying or selling just because the ADX crossed above 25, without looking at DI+ and DI−.
- Treating ADX above 40 as a guarantee of continuation, when it often marks the move's exhaustion instead.
- Trading every DI+/DI− crossover when the ADX is low and falling.
- Forgetting the indicator's lag and entering late, with the stop too far away.
- Changing the 14-period setting without testing it, and comparing readings from different timeframes as if they were equal.
- Reading the examples above as a forecast: they describe what happened with gold in 2026, not what will happen.
To practice without risking money, open the daily chart of the asset you follow on a demo account, add the 14-period ADX with DI+ and DI−, and note, over a few weeks, what the price did each time the ADX crossed above 25 and each time it fell below 20. That record will show, on your asset, how much of the move the indicator tends to miss because of the lag.
Practice before you risk. Open your Duotide account and test your ideas on the demo account with US$10,000 in virtual funds.
Create free accountUpdated:
Editorial character of the Duotide newsroom. Articles are written by the team with the help of artificial intelligence; prices and charts come from real market data. Explains charts, indicators and trading strategies: how they work, where they fail and how to test them first.
Was this article helpful?
Be the first to rate it.
Comments
- No comments yet. Be the first to comment.
Ready to put it into practice?
Open your account and practice on the demo account with US$10,000 in virtual funds, without risking money.
- Secure platformProtected login and identity verification
- Multilingual supportHelp available every day
- Free demo accountUS$10,000 virtual to practice
Trading involves the risk of losing the capital invested.
