

 Português pt
 Español es
 العربية ar
 বাংলা bn
 Deutsch de
 Filipino fil
 Français fr
 हिन्दी hi
 Bahasa Indonesia id
 Italiano it
 Русский ru
 Svenska sv
 ไทย th
 Türkçe tr
 Tiếng Việt vi
 简体中文 zh
Updated:
Risk managementBankroll Management in Trading: 7 Techniques With a Real Example
 Camila NascimentoEditorial character · Risk & Behavior Desk

Quick answer
Bankroll management is the set of rules that limits how much capital you risk per trade, per day, and per month. The most used techniques are risking 1% to 2% per trade, setting a daily loss limit, adjusting position size to volatility (using the ATR, for example), and cutting exposure after a losing streak. They don't guarantee profit: they exist so a bad streak doesn't wipe out the bankroll.
The risk-reward ratio looks at one trade at a time. Bankroll management looks at the whole picture: how much of your total capital you expose, how often, and how that capital behaves over weeks and months. It's that bigger picture that decides whether a trader gets through a bad streak or loses the entire bankroll in a few days.
No bankroll management technique guarantees profit. They exist to control the damage when things go wrong, because at some point they will. In this guide, the examples use Ether's real daily quotes (ETH/USDT on Binance) between April and October 2026, to show how volatility changes the right position size.
What bankroll management is
Bankroll management is the set of rules that defines how much money goes into each trade, how much you're willing to lose per day and per month, and what changes after a losing streak. The math that matters most is the recovery math: losing 20% of the bankroll requires a 25% gain just to get back to the starting point; losing 50% requires a 100% gain. The bigger the hole, the harder it is to climb out of.
Look at the effect of ten losses in a row, a situation that happens even with methods that work:
- Risking 1% per trade, about 90.4% of the bankroll is left (0.99 raised to 10).
- Risking 2%, about 81.7% is left.
- Risking 5%, about 59.9% is left, and recovery now requires a gain of almost 67%.

The 7 bankroll management techniques
1. Fixed percentage per trade
Instead of risking a fixed amount, set a percentage of your total capital, usually between 1% and 2%. If the bankroll grows, the amount at risk grows with it; if it shrinks after losses, the amount at risk shrinks on its own, which keeps a bad streak from snowballing. Risking 1% doesn't mean buying 1% of the bankroll: it means that if the stop is hit, the loss will be 1%.
2. Daily loss limit
Before the day starts, set a loss ceiling at which you stop. With a R$ 5,000.00 bankroll and a 5% limit, you end the day after losing R$ 250.00, no matter how many trades it took. The limit exists for the days when your head isn't in the right place or the market is behaving abnormally.
3. Diversify across loosely correlated assets
Two stocks in the same sector, or two currency pairs that react to the same news, multiply the risk without multiplying the protection. Three 1% positions in assets that move together behave like a single 3% position.
4. Adjust position size to volatility
A more volatile asset requires a smaller position to keep the same dollar risk. The practical way to do this is to use the ATR (average true range), which measures how much the asset usually swings per day, and calculate position size from it. That's the technique we show with numbers right below.
5. Keep trading capital separate from savings
Only use part of your available money to trade, and keep the rest out of the market. The amount set aside for trading should be money that, if lost, wouldn't put your bills or obligations at risk.
6. Cut exposure after a losing streak
Many traders do the opposite of what they should and size up after losing, trying to recover fast. The safer rule is the opposite: after two or three losses in a row, cut from 1% to 0.5% per trade and only go back to the normal percentage after a consistent streak.
7. Review the plan every month
The bankroll changes size, the assets you trade change, and so does your routine. Looking at your trade history once a month shows whether the percentages still make sense or need adjusting.
How to calculate position size with the ATR
The formula combines techniques 1 and 4:
- Dollar risk = bankroll × percentage per trade.
- Stop distance = ATR × a multiplier (2 is a common value).
- Quantity = dollar risk ÷ stop distance.
With a $10,000.00 bankroll and 1% risk, the risk per trade is $100.00. See how the same rule changes the ETH position size based on the 14-day ATR:
- April 14, 2026: ATR of $112.51, the highest in the period, with ETH at $2,322.44. Stop at 2 ATR = $225.02. Quantity = 100 ÷ 225.02 = 0.444 ETH, about $1,032.10 in exposure.
- August 18, 2026: ATR of $46.24, the lowest in the period, with ETH at $1,917.85. Stop at 2 ATR = $92.48. Quantity = 100 ÷ 92.48 = 1.081 ETH, about $2,073.80.
- October 7, 2026: ATR of $86.64, with ETH at $2,574.14. Stop at 2 ATR = $173.28. Quantity = 0.577 ETH, about $1,485.54.
The risk is always $100.00. What changes is the quantity: in April, with the market more agitated, the position was half the size of the one in August.

Real example: Ether's ATR in 2026
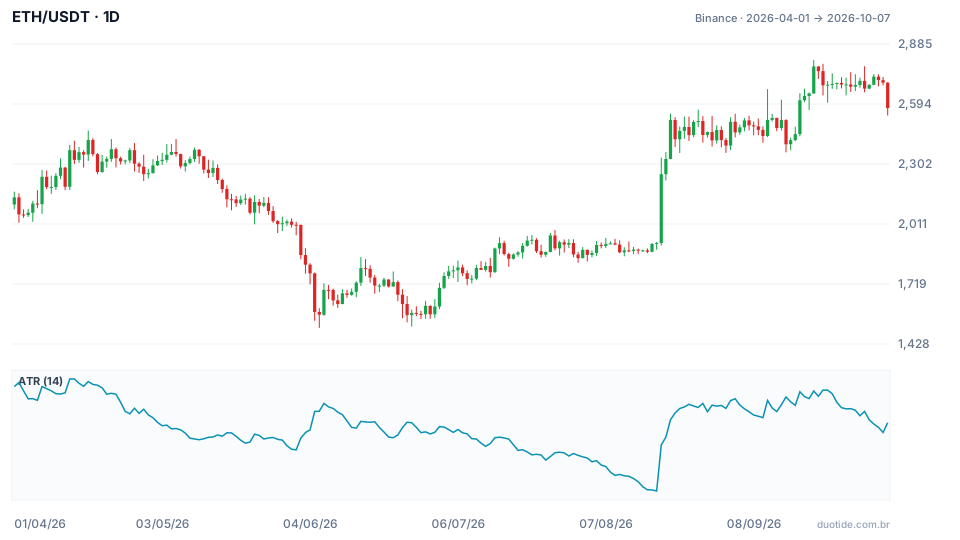
The chart shows the ETH price and, below it, the 14-day ATR. Three moments help explain why bankroll management can't rely on a fixed number:
April: high volatility, smaller position
At the start of April the ATR was near $108 and reached $112.51 on April 14. Anyone using the same $90 stop from a calmer period would have been stopped out by the market's normal noise. The high ATR called for a wider stop and, to keep the risk at 1%, a smaller position.
August: the calm before the jump
On August 18 the ATR was at the lowest level in the window, $46.24. The next day, August 19, ETH went from $1,917.85 to $2,252.80, a 17.5% jump in a single day, with a $427.65 range between the low and the high, more than nine times the previous day's ATR. A short position with a 2 ATR stop would have been hit with room to spare. A low ATR doesn't promise calm; it only describes the recent past.
June to October: the full cycle
The period's low came on June 6, at $1,505.68, and the high on September 21, at $2,807.34. Between those two points, the ATR stayed below $65 through much of August, with a low of $46.24, and climbed back above $100 in September. A rule based on the ATR tracks these changes on its own; a fixed-quantity rule doesn't.
How to use these techniques together
Build layers of protection
The techniques complement each other. A simple plan: risk 1% per trade, with quantity calculated from the ATR; stop after losing 3% in a day; never stack more than 3% of risk in assets that move together; cut to 0.5% after three losses in a row.
Write the plan before you trade
Rules decided in the middle of a trade are usually decided by emotion. Write down the percentages and limits and treat them as fixed until the next monthly review.
Limitations
The stop doesn't guarantee the exit price: in jumps like the one on August 19, or in gap openings, execution can come in worse than planned, and the loss goes past 1%. The ATR also looks backward and doesn't anticipate news. That's why it's worth keeping a safety margin and avoiding trading with everything the calculation would allow.
Common mistakes in bankroll management
- Confusing 1% risk with investing 1% of the bankroll: what limits the loss is the stop distance.
- Using the same quantity on every asset and in every volatility phase.
- Sizing up after losses to recover fast.
- Opening several correlated positions and thinking the risk is diversified.
- Moving the stop farther away when the price gets close to it.
- Forgetting that the examples above describe what happened, not what will happen.
To practice without risking money, open a demo account, pick an asset, calculate each position's size using the ATR and 1% risk, and record the result, the maximum drawdown, and the longest losing streak over a few weeks. That record shows whether your plan can handle the real market.
Practice before you risk. Open your Duotide account and test your ideas on the demo account with US$10,000 in virtual funds.
Create free accountUpdated:
Editorial character of the Duotide newsroom. Articles are written by the team with the help of artificial intelligence; prices and charts come from real market data. Writes about risk management, position sizing and the psychology behind traders' decisions.
Was this article helpful?
Be the first to rate it.
Comments
- No comments yet. Be the first to comment.
Ready to put it into practice?
Open your account and practice on the demo account with US$10,000 in virtual funds, without risking money.
- Secure platformProtected login and identity verification
- Multilingual supportHelp available every day
- Free demo accountUS$10,000 virtual to practice
Trading involves the risk of losing the capital invested.
