

 Português pt
 Español es
 العربية ar
 বাংলা bn
 Deutsch de
 Filipino fil
 Français fr
 हिन्दी hi
 Bahasa Indonesia id
 Italiano it
 Русский ru
 Svenska sv
 ไทย th
 Türkçe tr
 Tiếng Việt vi
 简体中文 zh
Updated:
IndicatorsCenter of Gravity (COG) Indicator: What It Is and How to Use It
 Naomi TanakaEditorial character · Analysis Desk

Quick answer
The Center of Gravity (COG) is an oscillator created by John Ehlers that gives different weights to the prices in a window, usually 10 periods, to indicate turns with less lag than a moving average. The main signal is the COG crossing its signal line, which is just the previous period's COG. It reacts fast, but generates many false signals in markets with no clear cycle.
One of the biggest annoyances with moving averages is lag: since they're calculated from past prices, the turning signal always arrives after the move has already started. The Center of Gravity indicator, often called by its acronym, COG, was developed by engineer John Ehlers specifically to try to reduce that lag.
In this guide we show the formula, a full calculation with the euro against the dollar (EUR/USD) on October 7, 2026, and what the indicator actually showed between April and October 2026, including the signals that didn't work.
What the Center of Gravity is
In physics, the center of gravity of a set of weights is the balance point between them. Ehlers applied the idea to a window of prices: each price gets a weight based on its position in the window, and the result shows whether the most recent prices sit above or below the older ones.
The COG is plotted as an oscillator, along with a copy of itself delayed by one period, which acts as a signal line. The crossover between the two lines is the main signal, somewhat similar to the MACD, but with a different calculation basis and much less smoothing.

How to calculate the Center of Gravity
With a window of N periods (the default is 10) and each candle's median price, (high + low) ÷ 2:
- Numerator: add up each price multiplied by its position, with a weight of 1 for today's candle, 2 for yesterday's, and so on up to 10 for the oldest.
- Denominator: add up the 10 prices with no weight.
- COG = −numerator ÷ denominator.
- Signal line: the previous period's COG.
If every price were the same, the COG would come out to exactly −5.5, the average of positions 1 through 10. When recent prices are higher than older ones, the COG sits above −5.5; when they're lower, it sits below. Some platforms add 5.5 to the result to center the oscillator at zero.
Example with EUR/USD on October 7, 2026
The median prices of the ten sessions through October 7, from most recent to oldest, were: 1.12111 (Oct 7), 1.12397 (Oct 6), 1.12099 (Oct 5), 1.12543 (Oct 2), 1.12793 (Oct 1), 1.13535 (Sep 30), 1.13505 (Sep 29), 1.13732 (Sep 28), 1.13901 (Sep 25), and 1.13802 (Sep 24).
- Numerator: 1 × 1.12111 + 2 × 1.12397 + … + 10 × 1.13802 = 62.3607
- Denominator: 1.12111 + 1.12397 + … + 1.13802 = 11.3042
- COG = −62.3607 ÷ 11.3042 = −5.5166
The value came out a bit below −5.5, which confirms what price was showing: the most recent days sat below the older ones in the window. Centered, the COG is −0.01660, a bit below the previous day's −0.01657, which set up a cross to the downside on October 7.
Real example: EUR/USD's COG in 2026
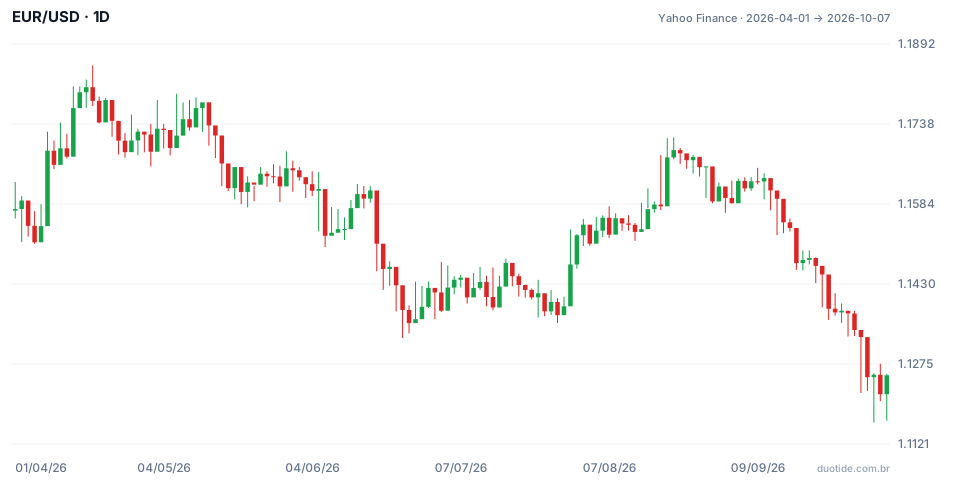
The chart shows EUR/USD's daily candles; the COG values were calculated on those quotes. Over the period, the pair fell from 1.1574 to 1.1254 (−2.8%), with a high of 1.1851 on April 17 and a low of 1.1162 on October 5. Across 136 sessions, the 10-period COG generated 30 crossovers with the signal line, about one every four or five sessions.
April: a downward cross on the day of the high
On April 17, the day of the period's high, the COG crossed below the signal line with the pair closing at 1.1783. Five sessions later the price was 0.84% lower. It was the best example of what the indicator promises: a turn marked near the actual turning point.
June: one good signal and one bad one in a row
On June 12 the COG crossed up with the pair at 1.1576, but five sessions later the price was 1.01% lower. On June 18 came the cross down, at 1.1507, and five sessions later the pair was at 1.1354, down 1.33%. Anyone following both signals would have lost on the first and gained on the second.
September: signals flipping sides
On September 23 the COG crossed up with the pair at 1.1448; on September 24 it crossed down; on September 25, up again. Five sessions after the first signal, on September 30, the price was at 1.1341, 0.94% lower. Three opposite signals in three days: that's the kind of noise the indicator generates when price moves in small steps.
Counting the 27 signals that already had five sessions of history afterward, price moved in the crossover's direction in 17 of them, about 63%. That doesn't include costs and says nothing about the size of the gains and losses.

How to use the Center of Gravity
Signal-line crossover
The COG crossing above the signal line suggests the start of an upward move; crossing below, a downward one. Since the signal line is just the previous value, the crossover amounts to saying the COG changed direction.
Trend filter
To cut down on noise, use only the crossovers that favor a larger trend, defined by a 50- or 200-period average, or require price to confirm by breaking the signal candle's high or low.
Cyclical markets
Like other Ehlers indicators, the COG was designed for markets that swing in cycles, alternating rallies and pullbacks within a range. In a long, firm trend, it keeps turning at every pause and generates signals against the trend.
Limitations
The smaller lag comes at a cost: more false signals. The 10-period COG changes direction often, as shown by the 30 crossovers in a bit over six months. It also has no fixed overbought or oversold levels, so it doesn't tell you whether price is expensive or cheap.
Common mistakes when using the Center of Gravity
- Trading every crossover with no trend filter or confirmation.
- Using the COG in a strong trend expecting it to mark the end of the move.
- Forgetting that different versions center the value at zero, or not, and use different prices (close or median price).
- Shortening the period to "gain speed" without testing: the number of false signals grows.
- Reading the example's win rate as a guarantee: it describes what happened on EUR/USD, not what will happen.
To practice, add the Center of Gravity to a currency pair's chart on a demo account and log every crossover for a few weeks: date, price, direction, and the price five periods later. Do the same with a trend filter and compare the two records.
Practice before you risk. Open your Duotide account and test your ideas on the demo account with US$10,000 in virtual funds.
Create free accountUpdated:
Editorial character of the Duotide newsroom. Articles are written by the team with the help of artificial intelligence; prices and charts come from real market data. Explains charts, indicators and trading strategies: how they work, where they fail and how to test them first.
Was this article helpful?
Be the first to rate it.
Comments
- No comments yet. Be the first to comment.
Ready to put it into practice?
Open your account and practice on the demo account with US$10,000 in virtual funds, without risking money.
- Secure platformProtected login and identity verification
- Multilingual supportHelp available every day
- Free demo accountUS$10,000 virtual to practice
Trading involves the risk of losing the capital invested.
