

 Português pt
 Español es
 العربية ar
 বাংলা bn
 Deutsch de
 Filipino fil
 Français fr
 हिन्दी hi
 Bahasa Indonesia id
 Italiano it
 Русский ru
 Svenska sv
 ไทย th
 Türkçe tr
 Tiếng Việt vi
 简体中文 zh
Updated:
IndicatorsChande Forecast Oscillator (CFO): What It Is and How to Calculate It
 Naomi TanakaEditorial character · Analysis Desk

Quick answer
The Chande Forecast Oscillator (CFO) measures, as a percentage, how much the current close is above or below the value predicted by a linear regression of the last periods, usually 14. Positive CFO indicates the price moving faster than the recent trend; negative, slower or falling. It confirms strength and loss of strength, but it flips sign frequently in sideways markets.
Tushar Chande, an analyst and statistician also known for the Aroon and the CMO, proposed the Chande Forecast Oscillator (CFO) with a simple idea: instead of comparing the price with an average, compare the price with the straight line that best describes the recent move. If the close sits above that line, the market is moving faster than the trend itself suggested; if it sits below, it's losing momentum.
The indicator is less popular than the RSI or the MACD, but it's available on most charting platforms. In this guide we use real daily Microsoft (MSFT, Yahoo Finance data) quotes between April and October 2026 to do the math by hand and show what the 14-period CFO actually indicated.
What the Chande Forecast Oscillator Is
The CFO is an oscillator with no fixed bounds that revolves around zero. On every candle, it draws a linear regression using the last N closes (14 is the most commonly used value), takes that line's value at the current candle, and compares it with the actual close. The result comes out as a percentage of the price.
- CFO above zero: the close came in above the value predicted by the regression. The price is accelerating relative to the recent linear trend.
- CFO below zero: the close came in below the forecast. The rally lost momentum, or the price is falling.
- CFO near zero: the price is moving practically right on its own trend line.
Since the scale is percentage-based, the same value carries different weight across different assets: a CFO of 3 is a lot for a low-volatility currency pair and little for a cryptocurrency.

How to Calculate the CFO
The formula has two steps:
- Forecast value (F): fit a line y = a + b × x to the last 14 closes, numbering the candles from 1 to 14, and calculate the line's value at candle 14: F = a + b × 14.
- CFO = 100 × (close − F) ÷ close.
The line's slope comes from the least squares method: b = (n × Σxy − Σx × Σy) ÷ (n × Σx² − (Σx)²), and the intercept is a = (Σy − b × Σx) ÷ n. It looks like a lot of work, but the platform does it on its own; it's worth doing once to understand what the number means.
Example with Real Microsoft Data
We took MSFT's 14 daily closes from July 13, 2026 ($390.99) to July 30, 2026 ($451.10). In the first 13 days the stock traded between $381.58 and $402.29; on July 30 it jumped from $390.54 to $451.10.
- Σx (1 + 2 + … + 14) = 105; Σx² = 1,015
- Σy (sum of the 14 closes) = 5,544.22; Σxy = 41,885.89
- Slope b = (14 × 41,885.89 − 105 × 5,544.22) ÷ (14 × 1,015 − 105²) = 1.3373 per day
- Intercept a = (5,544.22 − 1.3373 × 10⁵) ÷ 14 = 385.99
- Forecast value F = 385.99 + 1.3373 × 14 = $404.71
- CFO = 100 × (451.10 − 404.71) ÷ 451.10 = +10.28
Note that the simple average of the same 14 closes is $396.02. The regression gives a higher value because it already incorporates the period's slope, including the last day's jump. It was the highest CFO reading in the entire period analyzed.
Real Example: Microsoft's CFO in 2026
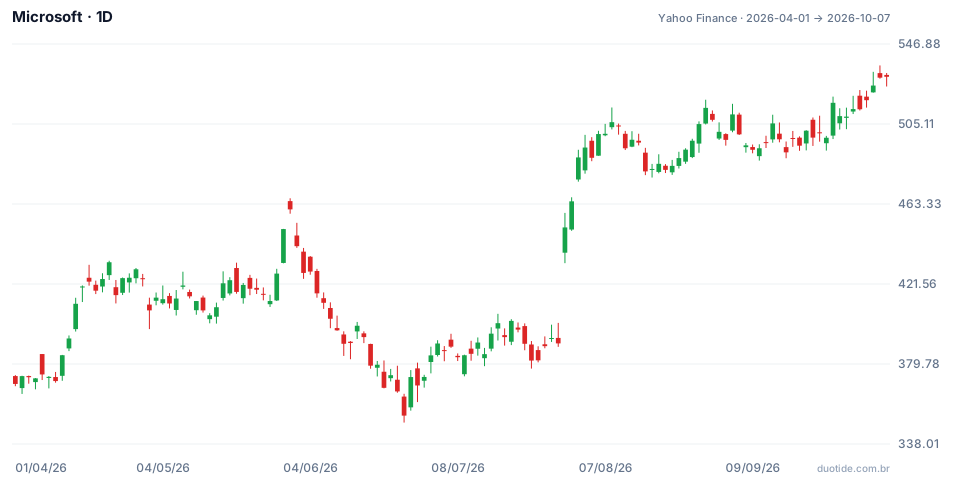
In the chart, MSFT starts at $369.37 on April 1, 2026 and closes on October 7, 2026 at $529.76, a 43.4% gain, with a low of $349.20 on June 25 and a high of $535.69 on October 6. Three moments show what the 14-period CFO did along the way.
June: Turning Negative Before a 20% Drop
On June 1 the CFO was at +4.48 with the stock at $460.52. The very next day it turned negative (−0.32), with the close at $441.31, and reached −5.00 on June 9, at $403.41. The decline continued until the close of $352.83 on June 25, 20.0% below the June 2 price. Midway through, however, the CFO turned positive again on June 15 ($399.76) and stayed above zero for several days while the price was still falling: a false signal typical of anyone who relies on the zero crossing alone.
July and August: Acceleration and Loss of Momentum
The July 30 jump pushed the CFO to +10.28, and it stayed above 9 for the next two trading days. The price kept rising until it closed at $506.06 on August 10, 12.2% above July 30. But the CFO had already turned negative on August 7 (−1.64, with the stock at $499.99): the price was still rising, just more slowly than the line projected. The oscillator reached −7.34 on August 12 and the stock pulled back to $480.35 on August 17, 3.9% below August 7. When the CFO moved back above zero, on August 21 ($483.24), the stock rose 6.3% through August 28 ($513.53).
September: Many Crossings and Little Movement
From September 1 to October 7, the CFO flipped sign 8 times and stayed between −2.62 and +2.34, while the closes moved between $490.30 and $529.76. Across the entire 131-trading-day period there were 30 sign flips. In phases like this, every zero crossing says little: the price is practically glued to its own trend.

How to Use the Chande Forecast Oscillator
Zero-Line Crossing
The basic reading: the CFO moving from negative to positive indicates the price has gone back to exceeding its own projection; the reverse indicates a loss of strength. It works better as confirmation of a move that's already started than as an early warning, because the line is built from past data.
Extreme Readings
Very high values, like the +10 on July 30, show that the price moved far away from the recent trend in a short time. That can be real strength, as it was for MSFT, or an overstretch that corrects itself. The extreme alone doesn't say which of the two it is; compare it with the asset's own history to know what counts as an unusual value.
Divergences
If the price makes a new high and the CFO makes a smaller peak than the previous one, the price is rising less and less above its own trend. That's what happened between July 30 and August 10: the price rose, the CFO fell from +10.28 until it went negative. The divergence warns of a loss of momentum; it doesn't mark the date of the turn.
Choosing the Period
Short periods (5 to 9) make the CFO jumpy and multiply the crossings; long periods (20 to 30) smooth out the line and delay the signals. Test it on the asset you follow before changing the default of 14.
Limitations
The CFO assumes the trend is a straight line, which is rarely true for long. It lags on sharp turns, generates many signals in sideways markets, and carries no volume information. Since it's a relative of trend indicators, combining it with several moving averages just repeats the same information; volume, volatility, and support and resistance levels add more.
Common Mistakes When Using the CFO
- Buying or selling on every zero crossing without checking whether the market is trending or sideways.
- Treating a high CFO as an automatic sell signal: on July 30 the record reading came at the start of a further 12%-plus rally.
- Comparing the CFO value between assets of different volatility as if it were the same scale.
- Confusing the CFO with the distance to a moving average: the regression includes the slope and reacts differently.
- Forgetting that the examples above describe what happened, not what will happen.
To practice, open the daily chart of an asset you follow in your demo account, add the 14-period CFO, and note down, over a few weeks, what the price did after each zero crossing and each extreme reading. That record shows whether the indicator adds anything to what you already use.
Practice before you risk. Open your Duotide account and test your ideas on the demo account with US$10,000 in virtual funds.
Create free accountUpdated:
Editorial character of the Duotide newsroom. Articles are written by the team with the help of artificial intelligence; prices and charts come from real market data. Explains charts, indicators and trading strategies: how they work, where they fail and how to test them first.
Was this article helpful?
Be the first to rate it.
Comments
- No comments yet. Be the first to comment.
Ready to put it into practice?
Open your account and practice on the demo account with US$10,000 in virtual funds, without risking money.
- Secure platformProtected login and identity verification
- Multilingual supportHelp available every day
- Free demo accountUS$10,000 virtual to practice
Trading involves the risk of losing the capital invested.
