

 Português pt
 Español es
 العربية ar
 বাংলা bn
 Deutsch de
 Filipino fil
 Français fr
 हिन्दी hi
 Bahasa Indonesia id
 Italiano it
 Русский ru
 Svenska sv
 ไทย th
 Türkçe tr
 Tiếng Việt vi
 简体中文 zh
Updated:
Risk managementHow CFDs Work: Leverage, Margin, and Stop-Out in Practice
 Camila NascimentoEditorial character · Risk & Behavior Desk

Quick answer
A CFD (contract for difference) is an agreement with the broker to exchange an asset's price difference between opening and closing the position, without owning the asset. The broker requires only a margin, say 5% of the exposure, which equals 1:20 leverage: every 1% move in the asset becomes a 20% gain or loss on the margin. If equity falls too far, the position closes automatically (stop-out).
On the platform's screen, opening a CFD looks just like buying a stock: a buy button, a sell button, and the price ticking along. Under the hood, though, the trade works differently, and it's in that machinery, margin, leverage, and automatic closeout, that most of the risk lives.
In this guide we take the CFD apart piece by piece and run the numbers with real daily S&P 500 quotes (Yahoo Finance) from April to October 2026, including a week in June when a leveraged position would have been closed out at the worst possible moment.
What a CFD is
CFD stands for contract for difference. It's an agreement between the trader and the broker to exchange the difference between an asset's price when the position opens and when it closes. Nobody actually buys the asset: there's no stock, gold bar, or index unit in your name, just the contract that tracks the price.
- Buy (long): gains if the price rises and loses if it falls.
- Sell (short): gains if the price falls and loses if it rises, with no need to borrow the asset.
- Counterparty: the contract is with the broker, not an exchange. The soundness and regulation of whoever offers the CFD are part of the risk.

How to calculate margin and leverage
The broker doesn't charge the full value of the position. It holds back only a fraction, called margin, as collateral. Leverage is the inverse of that fraction: 5% margin equals 1:20 leverage, which is the limit used for retail trading on major indices in several jurisdictions, such as the European Union.
Example with the S&P 500 on June 2, 2026, which closed at 7,609.78 points, on a CFD worth US$ 1 per point:
- Exposure: 7,609.78 × US$ 1 = US$ 7,609.78
- 5% margin: 7,609.78 × 0.05 = US$ 380.49
- Each point of movement: US$ 1 of gain or loss.
- A 1% drop in the index (about 76 points) takes away US$ 76, or 20% of the margin.
That's what leverage does: it multiplies by 20 the effect of every move on the money you put in. It works that way for gains, and it works that way for losses.
Margin level and stop-out
The platform tracks the margin level: account equity (balance plus open result) divided by the margin used. When that level drops below a threshold, often 50%, the broker closes the position automatically. That's the stop-out. It exists to keep the account from going negative, but it closes the trade at the point of greatest loss.
Real example: an S&P 500 CFD in June 2026
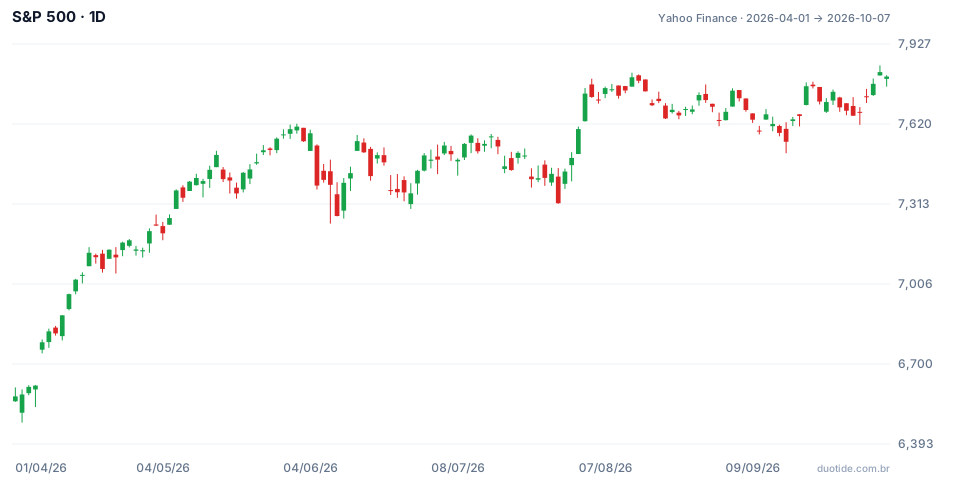
Over the chart's period the S&P 500 rose 18.65%, from 6,575.32 points on April 1 to 7,801.77 on October 7. Looking only at the start and the end, you'd picture a smooth climb. The path had stumbles, and with leverage, the stumbles count.
Buying at the short-term top
Suppose a US$ 500 account buys the CFD above on June 2, at 7,609.78 points, using US$ 380.49 of margin. With a 50% stop-out, the position closes if equity falls below US$ 190.25, that is, after a loss of US$ 309.75. That happens with the index at 7,300.03 points, just 4.1% below the entry.
June 5: the period's worst day
On June 5 the S&P 500 fell 2.64%, from 7,584.31 to 7,383.74 points, the window's largest daily drop. The account's equity fell to US$ 273.96: in three trading sessions, 45% of the money had vanished, with the index just 3% below the entry.
June 9: the stop-out
On June 9 the index touched an intraday low of 7,237.85 points, below the 7,300.03 level. The position would have closed with a loss of about US$ 309.75, 62% of the account. At the close the following day, June 10, the index stood at 7,266.99, 4.5% below June 2, the largest drawdown from a peak in the period. By June 15 it had already recovered to 7,554.29, and by October 7 it stood at 7,801.77, above the entry price. The market recovered; the leveraged position was no longer there to see it.
The same move, with no leverage, would have been a 4.5% drop at the worst point and a gain in the end. The difference between the two outcomes didn't come from analysis, it came from the margin.

How to use CFDs with risk control
Calculate the exposure, not just the margin
The number that matters is the exposure (US$ 7,609.78 in the example), not the US$ 380.49 margin. Ask yourself how much you'd lose if the asset dropped 5%. In the example, that would be about US$ 380, which wipes out the entire margin.
Use your own stop, before the stop-out
At entry, define the point where the trade stops making sense and place your stop there, with a position size where that loss represents a small fraction of the account, like 1% or 2%. The broker's stop-out is the last barrier, not a plan.
Count the cost of holding the position
Besides the spread paid on entry and exit, CFDs held overnight usually charge a daily financing fee on the exposure, not on the margin. In trades held for weeks, that cost adds up.
Limitations
The example uses the spot index's daily series. Index CFDs are usually traded over wider hours and track the futures contract, so the broker's price can differ slightly. Stops can also fill worse than the marked price on gap openings. And the results describe what happened in 2026, not what will happen.
Common mistakes with CFDs
- Looking at the margin as if it were the trade's total risk.
- Using the maximum leverage available just because it's available.
- Trading without your own stop and letting the stop-out decide the exit.
- Forgetting the financing fee on positions held for days or weeks.
- Concluding that a small drop in the asset is harmless: at 1:20, 4.1% was enough to wipe out the example account.
- Ignoring who the broker on the other side of the contract is and which regulator supervises it.
Before using real money, open the same trade on a demo account, note down the exposure, the margin, and the stop-out level, and track the margin level for a few days. Recording how equity reacts to every 1% move is the fastest way to understand leverage.
Practice before you risk. Open your Duotide account and test your ideas on the demo account with US$10,000 in virtual funds.
Create free accountUpdated:
Editorial character of the Duotide newsroom. Articles are written by the team with the help of artificial intelligence; prices and charts come from real market data. Writes about risk management, position sizing and the psychology behind traders' decisions.
Was this article helpful?
Be the first to rate it.
Comments
- No comments yet. Be the first to comment.
Ready to put it into practice?
Open your account and practice on the demo account with US$10,000 in virtual funds, without risking money.
- Secure platformProtected login and identity verification
- Multilingual supportHelp available every day
- Free demo accountUS$10,000 virtual to practice
Trading involves the risk of losing the capital invested.
