

 Português pt
 Español es
 العربية ar
 বাংলা bn
 Deutsch de
 Filipino fil
 Français fr
 हिन्दी hi
 Bahasa Indonesia id
 Italiano it
 Русский ru
 Svenska sv
 ไทย th
 Türkçe tr
 Tiếng Việt vi
 简体中文 zh
Updated:
IndicatorsHow to Build an Indicator Set Without Overdoing It
 Naomi TanakaEditorial character · Analysis Desk

Quick answer
A good indicator set uses one representative from each family: trend (like a moving average), momentum (RSI or stochastic), volatility (ATR), and volume. Indicators from the same family repeat the same information: on Microsoft in 2026, stochastic and Williams %R had a correlation of 1.00, and RSI and CCI, 0.81. More similar indicators don't mean more confirmation.
It's common to see a beginner's chart with seven or eight indicators stacked on top of each other, all flashing at the same time. The intention is good: looking for more confirmation before trading. The result is usually the opposite, more confusion and a false sense of certainty.
The problem is rarely a lack of indicators. It's not realizing that many of them, under different names, measure the same thing. In this guide we show that with numbers: we calculated several indicators on real daily Microsoft quotes (MSFT, Yahoo Finance) between April and October 2026 and measured how much they overlap.
What the four families of indicators are
Almost every technical indicator fits into one of these families:
- Trend: moving averages, MACD, ADX. They show where the price is heading and how strongly.
- Momentum (oscillators): RSI, stochastic, Williams %R, CCI. They measure the speed of recent movement and flag excesses.
- Volatility: ATR, Bollinger Bands. They measure how much the price tends to swing.
- Volume: volume itself, OBV. They show the participation behind the move.
Indicators from the same family answer the same question. Putting three of them on the chart doesn't give you three opinions: it gives you the same opinion three times.
How to tell whether two indicators are redundant
A simple way is correlation: a number from −1 to 1 that shows how closely two series move together. Close to 1, one almost repeats the other; close to 0, they carry different information. We calculated the daily correlation between Microsoft's indicators over the 131 trading sessions from April 1 to October 7, 2026:
- Stochastic (14) and Williams %R (14): 1.00. That's no coincidence: Williams %R is the same calculation as stochastic, shifted to a 0 to −100 scale.
- RSI (14) and CCI (20): 0.81.
- Stochastic and CCI: 0.81.
- RSI and stochastic: 0.74.
- Stochastic and ATR (14): 0.18.
Momentum oscillators move together; ATR, from another family, has almost no relationship with them. It's this kind of number that shows what's worth combining.
Real example: three oscillators on Microsoft in 2026
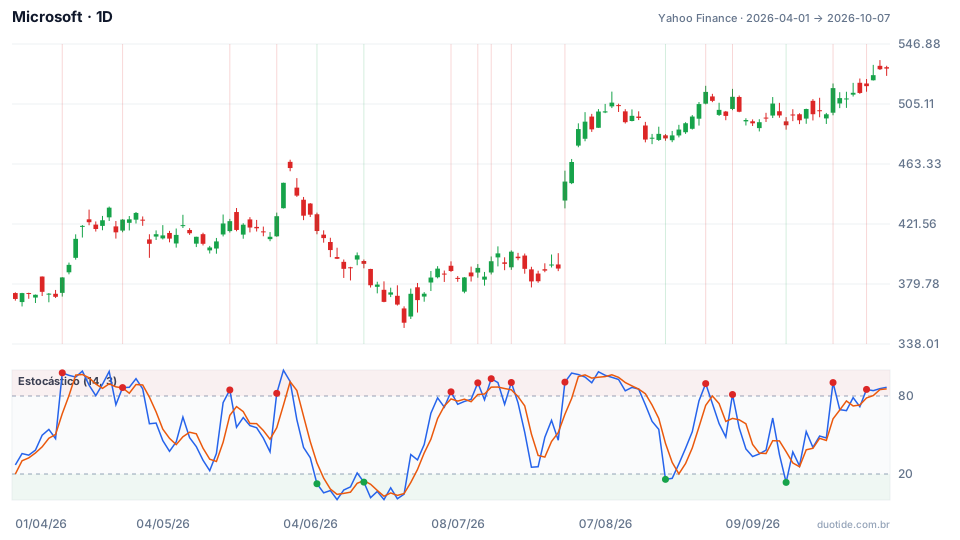
The chart shows Microsoft from April 1, 2026 (US$369.37) to October 7, 2026 (US$529.76), up 43.42%, with the 14-period stochastic in the panel below. The low was US$349.20 on June 25, and the high was US$535.69 on October 6.
Three confirmations that were really just one
The RSI went above 70 on 18 days during the period. On 13 of those 18 days, the stochastic was also above 80 and the CCI above 100. Anyone using all three would, most of the time, get three overbought signals at once and the impression of strong confirmation. In practice, it was the same fact, the recent rally, measured three times.
July 30: triple overbought, and the price kept rising
On July 30 the stock closed at US$451.10 with the RSI at 71.8, the stochastic at 90.7, and the CCI at 477. Three oscillators overbought. Ten sessions later, the stock was at US$496.88, up 10.15%. Before that, on July 20, the stochastic had crossed above 80 at US$402.29, and ten sessions later the price was 21.22% higher. In a strong trend, agreement among oscillators didn't hold the price back.
June: oversold that kept falling
On June 5 the stochastic crossed below 20 with the stock at US$416.67. On June 10 it was at 0.3, Williams %R at −99.7, and the CCI at −140: all oversold, with the price at US$397.36. Ten sessions after June 5, the stock was at US$367.34, down 11.84%, and the period's low only came on June 25. More oscillators agreeing didn't improve the entry timing.

How to build a lean indicator kit
One indicator per family
A reasonable starting point: one trend reference (for example, the 50- or 200-day moving average), one oscillator (RSI or stochastic, not both), one volatility measure (ATR, useful for stops and position size), and volume. Four different pieces of information are worth more than eight similar ones.
Define the role of each one
Before adding an indicator, write down what it's for in your plan: filtering direction, timing the entry, measuring risk, or confirming participation. If the role is already covered, it's redundant.
Test for redundancy on your asset
Put two indicators side by side and see whether they change direction together. If they almost always agree, like stochastic and Williams %R, keep just one.
Limitations
Correlations change depending on the asset, the period, and the parameters used; the numbers above apply to Microsoft between April and October 2026. No set of indicators eliminates risk, because all of them are calculated from past price and volume. The examples describe what happened, not what will happen.
Common mistakes when combining indicators
- Using several oscillators at once thinking they're independent confirmations.
- Having stochastic and Williams %R on the same chart: they're the same calculation.
- Adding a new indicator after every losing trade.
- Forgetting the families that are missing, like volatility and volume, while oscillators pile up.
- Changing parameters until the indicator gets the past right.
- Letting price take a back seat: indicators are derived from it, not the other way around.
To put this into practice, set up a demo account chart with one indicator from each family and use it for a few weeks without changing anything. Log every reading and what the price did afterward. Only swap a piece when your log shows it isn't doing its job.
Practice before you risk. Open your Duotide account and test your ideas on the demo account with US$10,000 in virtual funds.
Create free accountUpdated:
Editorial character of the Duotide newsroom. Articles are written by the team with the help of artificial intelligence; prices and charts come from real market data. Explains charts, indicators and trading strategies: how they work, where they fail and how to test them first.
Was this article helpful?
Be the first to rate it.
Comments
- No comments yet. Be the first to comment.
Ready to put it into practice?
Open your account and practice on the demo account with US$10,000 in virtual funds, without risking money.
- Secure platformProtected login and identity verification
- Multilingual supportHelp available every day
- Free demo accountUS$10,000 virtual to practice
Trading involves the risk of losing the capital invested.
