

 Português pt
 Español es
 العربية ar
 বাংলা bn
 Deutsch de
 Filipino fil
 Français fr
 हिन्दी hi
 Bahasa Indonesia id
 Italiano it
 Русский ru
 Svenska sv
 ไทย th
 Türkçe tr
 Tiếng Việt vi
 简体中文 zh
Updated:
IndicatorsHow to Choose the Right Indicator for Your Strategy
 Naomi TanakaEditorial character · Analysis Desk

Quick answer
Choose the indicator by the function it serves in your strategy: trend (moving averages, MACD, ADX), momentum (RSI, stochastic), volatility (ATR, Bollinger), or volume (OBV). In markets with a strong trend, trend indicators work better; in sideways markets, oscillators. Use at most one indicator per function so you don't repeat the same information.
There are hundreds of technical indicators, and a good chunk of them measure the same thing with slightly different formulas. Filling the chart with the RSI, the stochastic, Williams %R, and the CCI at the same time doesn't give you four confirmations: it gives you four versions of the same information. The more useful approach is to choose indicators by the function each one serves and by the type of market your strategy trades.
In this guide, we organize indicators by function and use Nvidia's real daily quotes (NVDA stock, from Yahoo Finance) between March and October 2026 to show how the same indicator got it right in one phase and wrong in another.
What each type of indicator measures
- Trend: moving averages, the MACD, and the ADX. They tell you where the price is heading and with how much strength.
- Momentum (oscillators): the RSI, the stochastic, Williams %R, and the CCI. They show whether the recent move is stretched relative to the range of the last few periods.
- Volatility: the ATR and Bollinger Bands. They measure how much the price swings, which is useful for sizing the stop and the position.
- Volume: the OBV and volume itself. They help assess whether there's real participation behind a move.
A balanced combination usually has at most one indicator per function. Two oscillators together rarely add anything.

How to choose: the ADX filter
The question that decides the indicator is: is the market trending or moving sideways? Trend tools work when there's a trend and generate false signals in sideways markets; oscillators do the opposite. The ADX (average directional index, by J. Welles Wilder) measures exactly the strength of the trend, without saying the direction:
- ADX above 25: a trend with strength. Favor moving averages, breakouts, and stops that trail the price.
- ADX below 20: a market with no clear direction. Oscillators and trades between support and resistance tend to work better.
- +DI and −DI: the two lines that accompany the ADX show the direction. +DI above −DI points to buying pressure; the reverse, selling pressure.
Real example: Nvidia's ADX in 2026
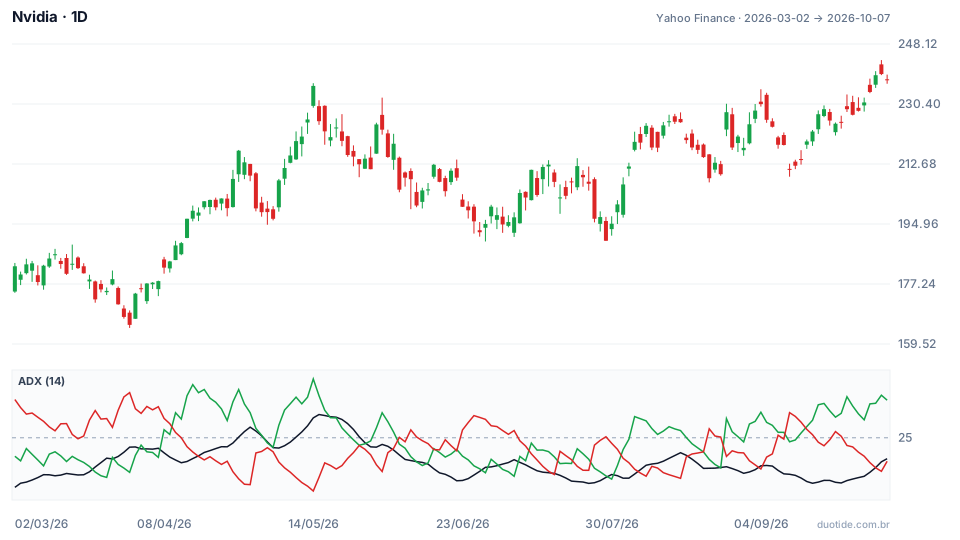
In the bottom panel, the black line is the 14-day ADX, the green one is the +DI, and the red one, the −DI. The dashed line marks 25. Between March 2 and October 7, 2026, the stock went from US$ 182.48 to US$ 237.47 (up 30.13%), but that path had two very different phases.
April and May: a strong trend
From the March 30 close of US$ 165.17 to US$ 225.32 on May 15, the stock rose 36.42%. The ADX passed 25 on April 27 and reached 31.16 on May 15, with the +DI peaking at 40.58 on May 14. In this phase, the oscillators got in the way: the stochastic crossed above 80 (overbought) on April 8, with the stock at US$ 182.08, and over the next 10 sessions it rose another 11.21%. Anyone selling because of the overbought reading would have left a trend early. Meanwhile, the stochastic's pullback below 20 on May 4 (US$ 198.48), within the trend, was followed by a 12.01% rally over 10 sessions.
June through September: a sideways market
Starting June 8, the ADX stayed below 20 almost the whole time, with a low of 12.92 on July 24. Between June 8 and September 30, closes swung between US$ 190.01 (July 29) and US$ 230.36 (September 4). Here the roles flipped. The price crossed the 20-day moving average six times in eight sessions, between August 24 and September 2, each crossover a trend signal that never confirmed. The stochastic, on the other hand, marked useful extremes: above 80 on July 14 (US$ 211.80), followed by a 6.98% drop over 10 sessions; below 20 on July 27 (US$ 196.51), followed by a 10.71% rally. Not every signal worked: the stochastic below 20 on June 17 (US$ 204.65) was followed by a 4.8% drop.
Early October: a signal taking shape
On October 7, the ADX stood at 19.46, rising from 13.02 on September 25, with the +DI (34.96) well above the −DI (18.77) and the price near the period's high, US$ 243.37, set on October 6. It's the kind of reading that suggests a possible new trend phase, but the ADX still hadn't passed 25. The examples describe what happened, not what will happen.

How to use this choice in your strategy
Define the type of strategy first
If you want to follow the trend, the base is moving averages or breakouts, with a strength filter like the ADX. If you want to trade reversals within a range, the base is an oscillator, with support and resistance clearly marked.
Add a volatility indicator for the risk
The ATR doesn't tell you when to enter, but it tells you how far to place the stop and what position size fits your account.
Test the combination
Before using it, check in the history how the combination performed during trending and sideways phases, like Nvidia's two phases above.
Limitations
Every indicator is calculated from past prices and lags. The ADX also lags: in 2026, it only passed 25 four weeks after the March 30 low, by which point a good part of the rally had already happened. No filter eliminates false signals; it only reduces how many there are.
Common mistakes when choosing indicators
- Using several oscillators together and treating each one as an independent confirmation.
- Applying the same overbought and oversold reading in a strong trend and in a sideways market.
- Following moving-average crossovers in a sideways market, where they repeat without direction.
- Switching indicators after every loss, instead of judging performance over a large sample.
- Skipping the volatility indicator and setting the stop by eye.
To practice without risking money, open the daily chart of an asset on a demo account, add the ADX and an oscillator, and note, over a few weeks, which phase the market was in (ADX above 25 or below 20) and what happened after each oscillator signal. That record shows which tool fits each phase of the asset you trade.
Practice before you risk. Open your Duotide account and test your ideas on the demo account with US$10,000 in virtual funds.
Create free accountUpdated:
Editorial character of the Duotide newsroom. Articles are written by the team with the help of artificial intelligence; prices and charts come from real market data. Explains charts, indicators and trading strategies: how they work, where they fail and how to test them first.
Was this article helpful?
Be the first to rate it.
Comments
- No comments yet. Be the first to comment.
Ready to put it into practice?
Open your account and practice on the demo account with US$10,000 in virtual funds, without risking money.
- Secure platformProtected login and identity verification
- Multilingual supportHelp available every day
- Free demo accountUS$10,000 virtual to practice
Trading involves the risk of losing the capital invested.
