

 Português pt
 Español es
 العربية ar
 বাংলা bn
 Deutsch de
 Filipino fil
 Français fr
 हिन्दी hi
 Bahasa Indonesia id
 Italiano it
 Русский ru
 Svenska sv
 ไทย th
 Türkçe tr
 Tiếng Việt vi
 简体中文 zh
Updated:
Risk managementHow to Diversify a Trading Portfolio and Reduce Risk
 Camila NascimentoEditorial character · Risk & Behavior Desk

Quick answer
To diversify a trading portfolio, spread the risk across assets that don't rise and fall together, like stocks, indices, commodities, and currencies, and limit how much each group can lose. What matters isn't the number of trades, but the correlation between them. Diversifying reduces the impact of a single mistake, but it doesn't eliminate losses or guarantee a higher return.
Having ten open trades doesn't mean you're diversified. If they all depend on the same move, like ten cryptocurrencies or ten tech stocks, a single piece of news can hit all of them at once. Real diversification means combining positions that react differently to the same events.
In this guide, we measure that with real daily quotes from four markets between April and October 2026: the S&P 500, gold, the Ibovespa, and bitcoin. The numbers show what diversification actually did over this period, including where it didn't help.
What diversifying a trading portfolio means
It means spreading risk so that no single position, and no single type of event, can cause major damage to the account. There are three main dimensions:
- Asset classes: stocks, indices, currencies, commodities, and cryptocurrencies respond to different factors.
- Sectors and regions: Brazilian banks and American tech companies don't depend on the same news.
- Time frames and strategies: a weeks-long trend trade and a short reversal trade rarely go wrong for the same reason on the same day.
How to calculate whether two assets diversify
The tool is the correlation between daily moves. It runs from −1 to +1: near +1, the assets rise and fall together; near 0, they move independently; negative, they tend to move in opposite directions. The calculation uses the two assets' daily percentage moves on the same days. Any spreadsheet does this with the CORREL function.
Between April 1 and October 7, 2026, the daily correlations were:
- Bitcoin × ether: 0.89. In practice, almost the same position.
- S&P 500 × gold: 0.48.
- Gold × bitcoin: 0.45.
- S&P 500 × bitcoin: 0.36.
- S&P 500 × Ibovespa: 0.30.
- Ibovespa × bitcoin: 0.18; Ibovespa × gold: 0.16.
The Ibovespa was the most independent market from the other three over this period. Bitcoin and ether, which a lot of people treat as two separate bets, moved almost in lockstep.
Real example: a portfolio with four markets in 2026
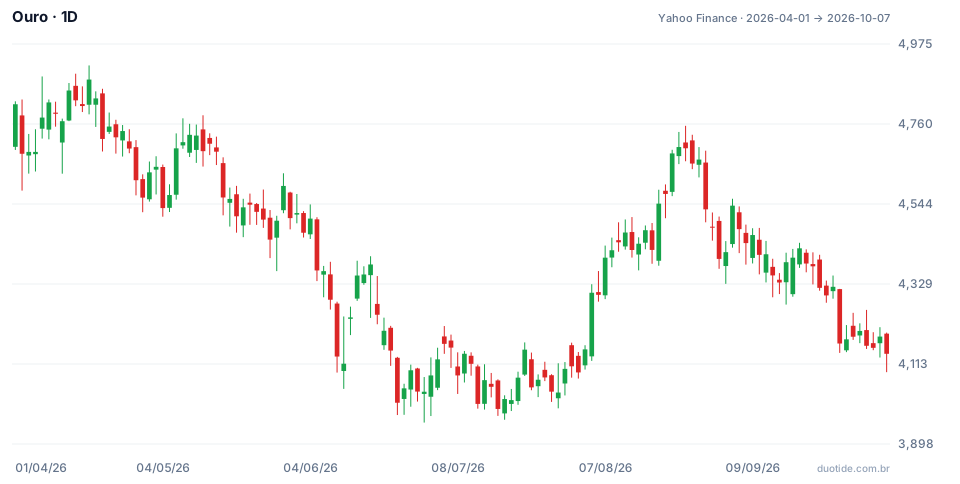
The chart shows gold, which went from US$ 4,813.10 on April 1 to US$ 4,140.70 on October 7, a drop of 13.97%, with a high of US$ 4,917.70 on April 17 and a low of US$ 3,955.40 on June 30. It's the piece that lost the most in the example portfolio, which is why it helps show how diversification works.
The portfolio split four ways
Suppose 10,000 split into four equal parts of 2,500 on April 1: S&P 500, gold, Ibovespa, and bitcoin. To isolate the effect of diversification, each part was measured by the asset's own move, without accounting for exchange rates. By October 7, the parts were worth 2,966.31 (S&P 500), 2,150.74 (gold), 2,717.46 (Ibovespa), and 3,058.18 (bitcoin), adding up to 10,892.69, up 8.93%. The portfolio's biggest drop from the peak was 12.62%, through June 25.
Comparing with each asset alone
- Bitcoin: up 22.33%, but with a drop of 28.69% from the peak (through June 30).
- Gold: down 13.97%, with a drop of 18.19% from the peak (through July 16).
- Ibovespa: up 8.7%, with a drop of 16.27% from the peak (through August 18).
- S&P 500: up 18.65%, with a maximum drop of only 4.5% (through June 10).
The portfolio fell less than three of the four individual assets. It wasn't the best choice on either return or risk: the S&P 500 alone had the best of both over this period. That's the point of diversification: it keeps you from depending on guessing which asset will be the best, at the cost of never holding only the best one.
A day diversification worked: August 11
On August 11, 2026, the Ibovespa fell 2.5%, its worst day of the period. That same day, gold rose 0.48%, the S&P 500 pulled back only 0.32%, and bitcoin, 0.58%. The simple average of the four moves was −0.73%: anyone holding only Brazilian stocks felt the entire drop; the split portfolio felt less than a third of it.
False diversification: bitcoin and ether
A 10,000 portfolio split evenly between bitcoin and ether ended the period at 12,129.72, but had a drop of 31.09% from the peak, bigger than bitcoin's alone. With a correlation of 0.89, combining the two didn't reduce the risk.

How to diversify in practice
Limit the risk by group, not just by trade
Risking 1% of the account per trade is a common rule. Also add up the risk of highly correlated positions: three 1% trades in cryptocurrencies that move together act like one trade of almost 3%.
Choose markets with different reasons to move
US interest rates, commodity prices, local politics, and crypto investor flows are different engines. A portfolio with positions tied to different engines tends to have lower correlations.
Review the correlations periodically
Correlation isn't constant. In moments of panic, many markets start falling together. Redo the calculation every month or two with recent data.
Limitations
Diversifying reduces the chance of major damage, but it doesn't eliminate losses and can reduce returns, as the gold portion of the example showed. It also doesn't replace a well-calculated stop and position size on every trade.
Common mistakes when diversifying a portfolio
- Counting the number of trades instead of measuring the correlation between them.
- Treating assets from the same group, like bitcoin and ether, as independent bets.
- Expecting the diversified portfolio to always outperform the best individual asset.
- Forgetting the exchange rate when the portfolio mixes assets in reais and dollars.
- Using an old correlation as if it held forever. The numbers above describe what happened between April and October 2026, not what will happen.
To practice without risking money, build a portfolio with three or four different markets on a demo account, calculate the correlation between them in a spreadsheet, and log the portfolio's value and each part's value every week. After a few months, you'll see with your own numbers which combinations actually reduce the risk.
Practice before you risk. Open your Duotide account and test your ideas on the demo account with US$10,000 in virtual funds.
Create free accountUpdated:
Editorial character of the Duotide newsroom. Articles are written by the team with the help of artificial intelligence; prices and charts come from real market data. Writes about risk management, position sizing and the psychology behind traders' decisions.
Was this article helpful?
Be the first to rate it.
Comments
- No comments yet. Be the first to comment.
Ready to put it into practice?
Open your account and practice on the demo account with US$10,000 in virtual funds, without risking money.
- Secure platformProtected login and identity verification
- Multilingual supportHelp available every day
- Free demo accountUS$10,000 virtual to practice
Trading involves the risk of losing the capital invested.
