

 Português pt
 Español es
 العربية ar
 বাংলা bn
 Deutsch de
 Filipino fil
 Français fr
 हिन्दी hi
 Bahasa Indonesia id
 Italiano it
 Русский ru
 Svenska sv
 ไทย th
 Türkçe tr
 Tiếng Việt vi
 简体中文 zh
Updated:
Technical analysisHow to Find Support and Resistance on the Chart
 Naomi TanakaEditorial character · Analysis Desk

Quick answer
To find support and resistance, mark on the daily chart the regions where the price stopped falling (support) or rising (resistance) more than once. Treat each level as a zone, not an exact price, and give more weight to the ones with several touches and strong reactions. They show where the price has reacted in the past, not where it will react.
Support and resistance are the first lines almost every trader learns to draw, and also the most commonly drawn wrong. A chart with fifteen horizontal lines doesn't help decide anything; two or three well-chosen levels help define where to enter, where to place the stop, and where to take profit.
In this guide, we use Apple's real daily quotes (AAPL stock, from Yahoo Finance) between March and October 2026 to show an objective marking method and what the price did at each level.
What support and resistance are
Support is a price region where the decline stopped more than once, because enough buyers showed up. Resistance is the opposite: a region where the rally stalled repeatedly, because sellers took control. These aren't exact prices, but zones. Anyone who treats support as a precise, penny-exact number ends up thinking the level “failed” every time the price pokes just past it.

How to find support and resistance
1. Start with the daily or weekly chart
Levels seen on larger timeframes are watched by more people and tend to be more relevant. After marking them on the daily chart, drop down to a smaller timeframe only to fine-tune the entry.
2. Mark highs and lows that stand out
An objective rule: a candle is a relevant high if its high is the biggest of the five previous sessions and the five that follow; a relevant low, if its low is the smallest over that same window. This filters out most insignificant swings.
3. Look for regions with more than one touch
A single high is just a high. When two or three highs or lows land within 1% or 2% of each other, you have a region. Draw a zone covering those points, not a thin line.
4. Assess the level's strength
- Number of touches: more touches mean more participants recognize the region.
- Reaction: how far the price moved after each touch.
- Time: levels that appear over months carry more weight than ones from just a few days.
Real example: support and resistance on Apple in 2026
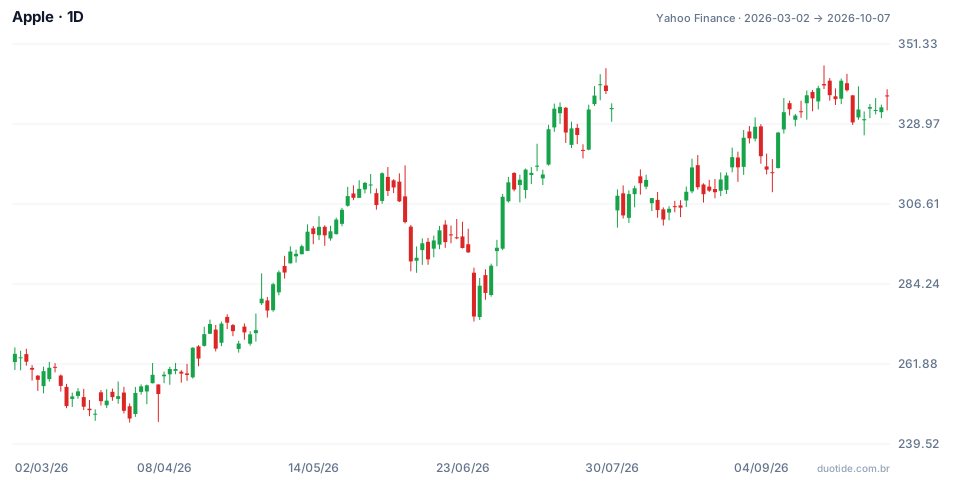
Between March 2 and October 7, 2026, the stock went from US$ 264.72 to US$ 336.67 (up 27.18%), with a low of US$ 245.51 on March 30 and a high of US$ 345.34 on September 22. Applying the five-session rule, three regions stand out.
March: support between US$ 245 and US$ 246
The lows of March 20 (US$ 246.00), March 30 (US$ 245.51), and April 7 (US$ 245.70) landed within US$ 0.50 of each other. That's three touches on the same zone in just over two weeks. From there, the price rose to US$ 317.40 on June 8, up 29.28% from March's low. Notice the third touch, on April 7, wasn't a close: the low touched the zone and the session closed at US$ 253.50. Support is read by the lows and the reaction, not just by the close.
June and July: resistance at US$ 315 to US$ 317 that became history
The highs of June 2 (US$ 315.45), June 3 (US$ 316.94), and June 8 (US$ 317.40) capped the rally, and the price fell back to US$ 273.75 by June 25. In July, the same zone held again: highs of US$ 315.48 on July 7, US$ 316.53 on July 9, and US$ 316.91 on July 10. The breakout came on July 15, with a close at US$ 327.50, well above the zone. Two weeks later, on July 29, the stock marked US$ 344.57. A resistance tested many times isn't eternal; when it gives way with a clear close above it, the move that follows can be strong.
August and September: resistance at US$ 345 and support at US$ 300
After the July 29 high, the stock fell 7.35% on July 31 and closed at US$ 308.91, with a low of exactly US$ 300.00. In the following weeks, the lows stopped at US$ 302.56 (August 3), US$ 301.32 (August 4), and US$ 300.57 (August 12): the US$ 300 region became support. On August 19 the price closed at US$ 316.83 and started climbing. On September 22, the high reached US$ 345.34, just 0.22% above July's high, and the price pulled back again, to a low of US$ 325.81 on October 1. The US$ 344 to US$ 346 zone acted as resistance twice. That describes what happened through October 7; it doesn't indicate what the price will do on the next test.

How to use support and resistance
To place the stop
On a buy near support, the stop goes below the zone, not right on it. On Apple in August, the lows ranged between US$ 300.00 and US$ 302.56. A stop at US$ 301, inside the zone, would have been hit on August 12 (low of US$ 300.57), a week before the price started climbing again; a stop a few dollars below US$ 300 would have had room for normal swings.
To set the target
The next resistance is a natural target for a buy. Anyone who bought near US$ 300 in August had the US$ 344 to US$ 346 zone as an exit reference.
Breakouts
Prefer breakouts confirmed by a close, not just an intraday high. On July 13, the high passed US$ 323, but the close landed at US$ 317.31, practically right on the resistance; confirmation only came two sessions later.
Limitations
Support and resistance show where the price has reacted in the past, not where it will react. News, quarterly results, and shifts in market mood cross through any line. The levels are also subjective: two people can mark slightly different zones on the same chart.
Common mistakes when marking support and resistance
- Drawing too many lines, one on every small high or low.
- Treating the level as an exact price, instead of a zone.
- Placing the stop right on top of the support, where a lot of people put theirs.
- Counting an intraday high that didn't hold on the close as a breakout.
- Forgetting to update the levels: a broken resistance, like July's US$ 317, stops being a ceiling.
To practice without risking money, open the daily chart of an asset on a demo account, apply the five-session rule, mark at most three zones, and log what the price did at each touch in the following weeks. That record quickly shows which levels you mark well and which are just noise.
Practice before you risk. Open your Duotide account and test your ideas on the demo account with US$10,000 in virtual funds.
Create free accountUpdated:
Editorial character of the Duotide newsroom. Articles are written by the team with the help of artificial intelligence; prices and charts come from real market data. Explains charts, indicators and trading strategies: how they work, where they fail and how to test them first.
Was this article helpful?
Be the first to rate it.
Comments
- No comments yet. Be the first to comment.
Ready to put it into practice?
Open your account and practice on the demo account with US$10,000 in virtual funds, without risking money.
- Secure platformProtected login and identity verification
- Multilingual supportHelp available every day
- Free demo accountUS$10,000 virtual to practice
Trading involves the risk of losing the capital invested.
