

 Português pt
 Español es
 العربية ar
 বাংলা bn
 Deutsch de
 Filipino fil
 Français fr
 हिन्दी hi
 Bahasa Indonesia id
 Italiano it
 Русский ru
 Svenska sv
 ไทย th
 Türkçe tr
 Tiếng Việt vi
 简体中文 zh
Updated:
StocksMicron (MU) stock in 2026: AI memory boom or cyclical risk
 Rafael AzevedoEditorial character · Markets Desk

Quick answer
Micron (MU) stock is driven by demand for AI memory, especially HBM, and by the price cycle of DRAM and NAND. In 2026 it rose 281.2% through October 7, but fell 39.1% between the June high and the end of July. The main risk is the sector's cyclical history: when supply starts growing again, prices and profits tend to fall.
In 2026, Micron Technology held a central position in the so-called AI memory boom. The debate among analysts stopped being whether AI demand was real and became how much of that optimism was already in the stock price, and how long the memory market could stay this tight before supply started growing again.
This article gathers the numbers Micron (ticker MU, on the Nasdaq) released through mid-2026 and uses the stock's actual daily chart, with the RSI, to show what happened from March to October. The business data reflects that moment and may have already changed. Nothing here is a recommendation to buy or sell.
What Micron does
Micron is one of three companies in the world capable of producing cutting-edge memory at scale, alongside Samsung and SK Hynix. It designs and manufactures DRAM and NAND memory chips and sells them to server makers, cloud providers, and makers of PCs, smartphones, and cars.
In the AI era, the company became a strategic supplier of high-bandwidth memory (HBM), used alongside the accelerators that train and run models. HBM4 capacity was, according to reports from that time, sold out through the end of 2026 under binding contracts.

The numbers released in 2026
- Second-fiscal-quarter 2026 revenue 196% higher than a year earlier, with gross margin around 70%.
- Annual revenue of about $37.4 billion, up about 49%, and earnings per share (EPS) of $21.15 for the 12 months through June.
- DRAM prices about 90% higher in the first quarter of 2026.
- Investment in new fabs exceeding $100 billion, according to reports from that time.
How to calculate the P/E with real prices
The P/E is the stock price divided by earnings per share. Using the EPS of $21.15 cited in June:
- Close on June 25, 2026, the year's highest: $1,213.56 ÷ 21.15 = P/E of 57.4.
- Close on July 29, 2026: $739.00 ÷ 21.15 = P/E of 34.9.
At the time, the market projected earnings several times higher for the following 12 months, which is why the forward P/E was much lower than the trailing one. This gap is typical of cyclical companies at the peak of the cycle: the multiple looks cheap precisely when earnings are peaking.
Real example: Micron's RSI in 2026
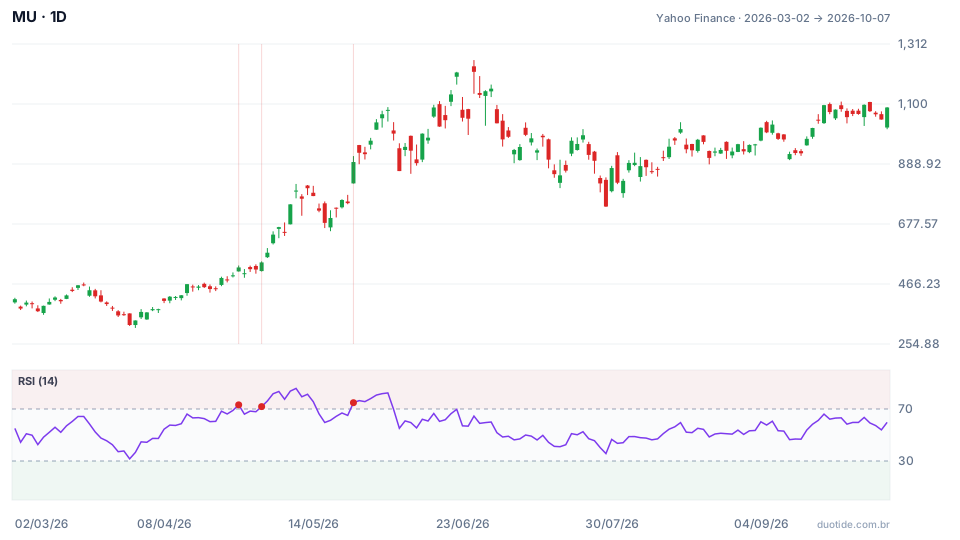
The chart shows MU's daily candles (Yahoo Finance) and the 14-day RSI. The stock closed 2025 at $285.41 and, on October 7, 2026, stood at $1,088.00, up 281.2% for the year. Three moments show what the RSI indicated, and what it did not.
April: overbought at the start of the rally
On April 27 the RSI crossed above 70 (73.2), with the stock at $524.56. Ten trading sessions later, it stood at $795.33, up 51.6%, and the RSI reached 85.84 on May 11. Anyone who sold just because the indicator was above 70 would have exited right at the start of the year's biggest move.
June: bearish divergence
On June 3, MU closed at $1,079.57 with the RSI at 82.37. On June 25 it made a higher close, $1,213.56, the year's high, but the RSI stood at just 64.54. Price making a higher high while the RSI makes a lower high is a bearish divergence: the rally was continuing, but with less strength. On July 29 the stock closed at $739.00, 39.1% below the June high, with the RSI at 35.69.
August to October: recovery without extremes
After the July low, the stock rose 47.2% through October 7 without the RSI going back above 70. The indicator stayed between 45 and 65 most of the time, with the price in a gradual uptrend. Not every rally shows up as overbought.

How to analyze Micron stock
How long the supply squeeze lasts
Micron's profit depends on memory prices, and prices depend on supply. Watch for signs of capacity expansion from Samsung and SK Hynix: historically, the cycle turns when all three ramp up production at the same time.
Long-term contracts
Binding HBM contracts with AI customers give revenue visibility. How those contracts evolve and get renewed says more about the following year than the last quarter's results.
Return on investment
More than $100 billion in new fabs only pays off if the market stays tight long enough. Free cash flow and gross margin, quarter after quarter, show whether that is happening.
Limitations
The RSI uses only past price, and on a stock that nearly quadrupled over the year, it spends weeks overbought. Divergences warn of weakening momentum, but they do not say when or how much the price will fall. And the P/E calculated above uses June's earnings, which change every quarter.
Common mistakes when analyzing Micron stock
- Treating a memory company as if it had stable growth: the sector is historically cyclical.
- Assuming a low P/E at the peak of earnings means a cheap stock.
- Automatically selling when the RSI crosses above 70 in a strong trend, as in April.
- Ignoring the divergence between price and RSI after a long rally, as in June.
- Forgetting that drops of more than 10% in a day happened three times during the year, and sizing the position as if the stock were stable.
- Reading the 2026 chart as a forecast: it shows what happened, not what will happen.
To study the stock without risking money, open MU's daily chart on a demo account, add the 14-period RSI, mark every crossing of 70 and every divergence, and record what the price did in the following weeks. In cyclical stocks, that record helps separate the point in the cycle from day-to-day noise.
Practice before you risk. Open your Duotide account and test your ideas on the demo account with US$10,000 in virtual funds.
Create free accountUpdated:
Editorial character of the Duotide newsroom. Articles are written by the team with the help of artificial intelligence; prices and charts come from real market data. Follows the news that moves prices — rates, stock markets, companies and commodities — explained without jargon.
Was this article helpful?
Be the first to rate it.
Comments
- No comments yet. Be the first to comment.
Ready to put it into practice?
Open your account and practice on the demo account with US$10,000 in virtual funds, without risking money.
- Secure platformProtected login and identity verification
- Multilingual supportHelp available every day
- Free demo accountUS$10,000 virtual to practice
Trading involves the risk of losing the capital invested.
