

 Português pt
 Español es
 العربية ar
 বাংলা bn
 Deutsch de
 Filipino fil
 Français fr
 हिन्दी hi
 Bahasa Indonesia id
 Italiano it
 Русский ru
 Svenska sv
 ไทย th
 Türkçe tr
 Tiếng Việt vi
 简体中文 zh
Updated:
StocksOracle (ORCL) stock in 2026: what moves the price, and the real chart
 Rafael AzevedoEditorial character · Markets Desk
Quick answer
Oracle (ORCL) stock is driven by AI cloud contracts, which pushed the backlog to about $553 billion, and by the cost of building the data centers to deliver them, which left free cash flow negative. In 2026 the stock rose as high as $248.15 in June, fell 40.9% in a month, and closed on October 7 down 26.3% for the year.
Oracle has been known for decades for databases and enterprise software, but in 2026 it started trading as a central piece of artificial intelligence infrastructure. Multibillion-dollar cloud contracts sit on the same balance sheet as heavy data center spending and negative free cash flow. That contrast helps explain why the stock swung so much during the year.
This article gathers the numbers released about Oracle (ticker ORCL, on the New York Stock Exchange) in mid-2026 and uses the stock's actual daily chart, with Bollinger Bands, to show what happened from March to October. The business data reflects that moment. Nothing here is a recommendation to buy or sell.
What Oracle does
Oracle sells databases, enterprise applications, and cloud infrastructure to governments, banks, healthcare networks, carriers, and large companies. Much of its revenue comes from long-term subscriptions, which gives more predictability than one-off license sales.
The recent focus is Oracle Cloud Infrastructure (OCI), which offers compute, storage, and networking, including services to train and run AI models. In that market the company competes with Amazon Web Services, Microsoft Azure, and Google Cloud, backed by a customer base that has used its databases for years.

The numbers released in 2026
- Remaining performance obligations (RPO) backlog estimated at $553 billion in the third quarter of fiscal 2026, up about 325% in a year, with large-scale contracts with OpenAI, Meta, and xAI.
- Annual revenue of about $57.4 billion, up 8.4%.
- Free cash flow negative by about $394 million, because of tens of billions of dollars a year in data center spending.
- Earnings per share (EPS) of $5.57 for the 12 months through June.
Two calculations that help explain the stock
- Backlog in years of revenue: $553 billion ÷ $57.4 billion = about 9.6 years of annual revenue. The contract already exists; the challenge is building the capacity to deliver it.
- P/E with real prices: at the year's closing high, $248.15 on June 1, the P/E was 248.15 ÷ 5.57 = 44.6. At the lowest close, $114.99 on July 24, it fell to 20.6. Same earnings, multiple cut in half in less than two months.
Real example: Oracle and Bollinger Bands in 2026
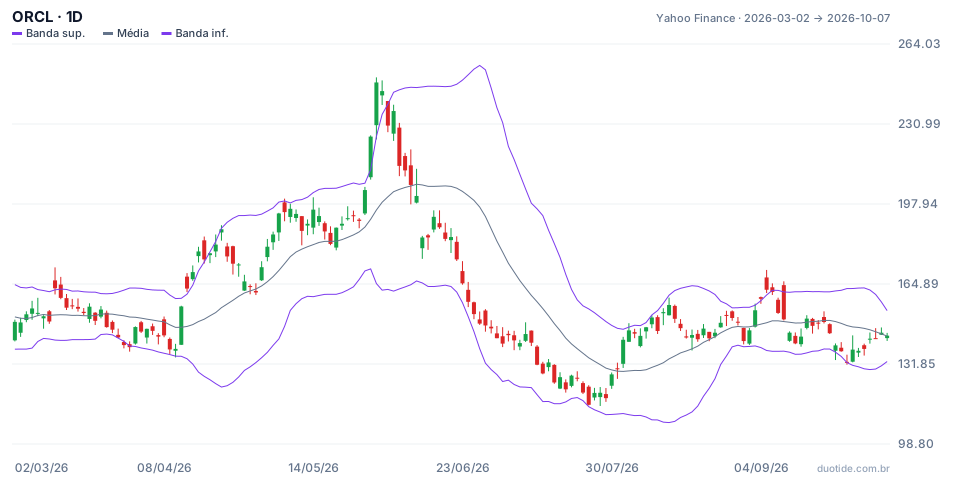
The chart shows ORCL's daily candles (Yahoo Finance) with 20-day Bollinger Bands at 2 standard deviations. The stock closed 2025 at $194.91 and, on October 7, 2026, stood at $143.56, down 26.3% for the year. The bands help show how volatility changed in each phase.
April: closing above the upper band was not a top signal
On April 13 the stock rose 12.7% in a day, from $138.09 to $155.62. Over the next four trading sessions, from April 14 to April 17, it closed above the upper band. Anyone who sold because the stock was "stretched" would have missed out: on June 1, ORCL closed at $248.15, 79.7% above the April 10 close. In a strong trend, the price can ride the upper band.
June: bands wide open, then a 40% drop
Between May 29 and June 2 the stock again closed three days above the upper band, after gains of 10.8% and 9.9% over two sessions. The reversal was sharp: on June 30 it closed at $146.55, 40.9% below the June 1 high. The day before, on June 29, the distance between the bands reached 62.9% of the average, the period's highest value. Even during the drop, the price never closed below the lower band, because the prior rally itself had widened the bands.
August and September: a band squeeze and a breakout that failed
On August 28 the 20-day average stood at $146.98 and the upper band at $155.03. The standard deviation was (155.03 − 146.98) ÷ 2 = 4.03, and the lower band, 146.98 − 2 × 4.03 = $138.93. Band width fell to 11% of the average, close to the period's lowest value: a squeeze, a sign of low volatility. On September 4 and September 8 the stock closed above the upper band, reaching $162.52. The breakout did not hold: on September 28 it closed at $132.60, 18.4% lower, practically touching the lower band.

How to analyze Oracle stock
Backlog and capacity
Every quarter, watch whether the RPO keeps growing and, especially, whether cloud revenue accelerates. A backlog worth almost ten years of revenue only turns into profit if the data centers are ready in time.
Cash and debt
With negative free cash flow, expansion depends on financing. The trajectory of the debt and its cost are as important as the size of the contracts.
Customer concentration
Much of the backlog comes from a handful of large AI customers. A change in plans from any one of them weighs on the stock.
Limitations
Bollinger Bands measure volatility, not direction: a price above the upper band can mean strength or excess, and only context tells them apart. The P/E above uses June's earnings, and the backlog and cash numbers change every quarter.
Common mistakes when analyzing Oracle stock
- Confusing backlog with guaranteed revenue: a signed contract still depends on delivery and on the customer honoring it.
- Ignoring the negative free cash flow and the debt used to finance the expansion.
- Automatically selling because the price closed above the upper band, as in April.
- Buying every breakout after a band squeeze without waiting for confirmation, as in September.
- Looking at the P/E on a single day for a stock that closed between $114.99 and $248.15 during the year.
- Reading the 2026 chart as a forecast: it shows what happened, not what will happen.
To study the stock without risking money, open ORCL's daily chart on a demo account, add the 20-period Bollinger Bands, and record what the price did after each close outside the bands and after each squeeze. Combine that with the backlog and cash numbers in every quarterly report.
Practice before you risk. Open your Duotide account and test your ideas on the demo account with US$10,000 in virtual funds.
Create free accountUpdated:
Editorial character of the Duotide newsroom. Articles are written by the team with the help of artificial intelligence; prices and charts come from real market data. Follows the news that moves prices — rates, stock markets, companies and commodities — explained without jargon.
Was this article helpful?
Be the first to rate it.
Comments
- No comments yet. Be the first to comment.
Ready to put it into practice?
Open your account and practice on the demo account with US$10,000 in virtual funds, without risking money.
- Secure platformProtected login and identity verification
- Multilingual supportHelp available every day
- Free demo accountUS$10,000 virtual to practice
Trading involves the risk of losing the capital invested.
