

 Português pt
 Español es
 العربية ar
 বাংলা bn
 Deutsch de
 Filipino fil
 Français fr
 हिन्दी hi
 Bahasa Indonesia id
 Italiano it
 Русский ru
 Svenska sv
 ไทย th
 Türkçe tr
 Tiếng Việt vi
 简体中文 zh
Updated:
IndicatorsRSI: How to Configure the Period and Levels of the Relative Strength Index
 Naomi TanakaEditorial character · Analysis Desk

Quick answer
The RSI comes configured with a period of 14 and levels of 70 (overbought) and 30 (oversold), and that's the best starting point for the daily chart. Shorter periods, like 7, make the indicator more sensitive and generate far more signals; longer periods, like 21, smooth it out and almost never reach the extremes. When you shorten the period, push the levels out to 80 and 20; when you lengthen it, bring them closer together.
Few indicators are as popular as the RSI, the relative strength index created by J. Welles Wilder in 1978. It shows up on practically every charting platform, and the basic reading, overbought above 70 and oversold below 30, tends to be one of the first things a beginner learns. What few people test is the effect of the settings: the same asset, over the same period, tells quite different stories with an RSI of 7, 14, or 21.
In this guide we use real daily prices for Apple stock (Yahoo Finance data) from March to October 2026 to show the calculation, compare the periods, and see what each setting would have signaled.
What the RSI is
The RSI measures the intensity of recent price moves on a scale from 0 to 100. It compares the average of gains with the average of losses over the last N periods: the more gains have dominated, the closer it is to 100; the more losses have dominated, the closer it is to 0. The default period is 14 candles, which on the daily chart means the last 14 sessions.

How to calculate the RSI
- Average gain: sum of the gains over the last 14 periods ÷ 14.
- Average loss: sum of the losses (in absolute value) over the same periods ÷ 14.
- RS = average gain ÷ average loss.
- RSI = 100 − 100 / (1 + RS).
Example with real Apple data
Between the close of May 7, 2026 ($287.44) and that of May 28, 2026 ($312.51) there are 14 daily changes: 10 up and 4 down.
- Sum of gains: $29.25 → average gain = 29.25 ÷ 14 = 2.089
- Sum of losses: $4.18 → average loss = 4.18 ÷ 14 = 0.299
- RS = 2.089 ÷ 0.299 = 7.00 (using the unrounded sums: 29.25 ÷ 4.18)
- RSI = 100 − 100 / (1 + 7.00) = 87.5
Platforms show 79.8 for that day, the highest value of the period. The difference comes from Wilder's smoothing: after the first calculation, each new average is (previous average × 13 + today's change) ÷ 14. That smoothing carries a bit of the older history and makes the RSI less extreme than a calculation with simple averages.
Real example: Apple's RSI in 2026
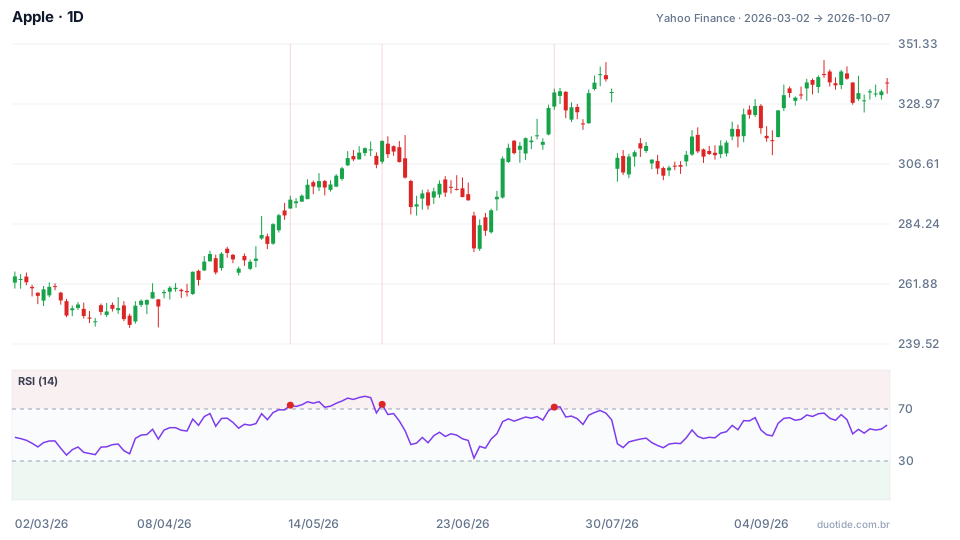
The stock went from $264.72 on March 2 to $336.67 on October 7, up 27.18%, with a low of $245.51 on March 30 and a high of $345.34 on September 22. The chart shows the 14-period RSI.
Three overbought readings, three outcomes
The 14-period RSI passed above 70 only three times. On May 8, with the stock at $293.32, the price was 5.28% higher ten sessions later. On June 2, at $315.20, it was 5.06% lower. On July 16, at $333.26, practically unchanged (+0.05%). The same reading, three opposite outcomes: overbought isn't a sell signal.
An oversold reading the 14-period RSI didn't catch
On June 25, the 14-period RSI dropped to 32.20, the period's lowest value, without reaching 30. The stock closed at $275.15 and, ten sessions later, was at $315.32, up 14.6%. Anyone waiting for 30 never got the signal; with a 7-period RSI, that same day marked 19.25.
Bearish divergence in September
On September 22, the stock closed at $339.75, above the close of May 28 ($312.51) and of July 16 ($333.26). The RSI, however, stood at 66.88, below the 79.79 of May and the 71.43 of July. Price at a higher high with RSI at a lower high is bearish divergence. Through October 7, the stock pulled back only slightly, to $336.67: the divergence showed a loss of strength, not a drop.

How to configure the RSI
Period: 7, 14, or 21
Over the same March-to-October window, the 7-period RSI passed above 70 thirteen times and fell below 30 seven times, with a peak of 87.26 and a low of 19.25. The 14-period RSI passed above 70 three times and never reached 30. The 21-period RSI peaked at just 74.52 and bottomed at 38.72; it crossed 70 four times, always by a small margin, and also never touched 30. A short period generates many signals and many false alarms; a long period generates few and late ones. 14 remains the most common starting point on the daily chart.
Levels: 70/30 or 80/20
Traders who use a short RSI often push the levels out to 80 and 20, to offset the jumpier indicator. Those who use a long RSI can bring them closer to 65 and 35. In a strong uptrend, some traders treat the 40-to-50 range as a pullback zone, instead of waiting for 30, which may never come, as on June 25.
Chart time frame
A 14-period RSI on the 5-minute chart looks at the last 70 minutes; on the daily chart, at nearly three weeks. Choose the period with the time frame you trade in mind, and don't compare readings from different time frames as if they were equal.
Limitations
The RSI uses only past price, lags at sharp turns, and knows nothing about news or earnings. It also doesn't compare assets: an RSI of 70 on a volatile stock isn't the same as an RSI of 70 on a broad index.
Common mistakes when configuring the RSI
- Shortening the period to get more signals without realizing most of them will be false.
- Keeping the 70/30 levels with an RSI of 5 or 7, which makes the indicator sit in the extreme zones all the time.
- Waiting for exactly 30 or 70 as if they were magic lines.
- Selling every overbought reading in an uptrend.
- Tweaking the period until it matches the past, which almost always makes future results worse.
- Forgetting that the examples above describe what happened with Apple, not what will happen.
To practice without risking money, put the same asset on a demo account with the RSI at 7, 14, and 21 side by side, and record, over a few weeks, how many signals each one gave and what the price did afterward. That log tells you more about the right setting for you than any ready-made rule.
Practice before you risk. Open your Duotide account and test your ideas on the demo account with US$10,000 in virtual funds.
Create free accountUpdated:
Editorial character of the Duotide newsroom. Articles are written by the team with the help of artificial intelligence; prices and charts come from real market data. Explains charts, indicators and trading strategies: how they work, where they fail and how to test them first.
Was this article helpful?
Be the first to rate it.
Comments
- No comments yet. Be the first to comment.
Ready to put it into practice?
Open your account and practice on the demo account with US$10,000 in virtual funds, without risking money.
- Secure platformProtected login and identity verification
- Multilingual supportHelp available every day
- Free demo accountUS$10,000 virtual to practice
Trading involves the risk of losing the capital invested.
