

 Português pt
 Español es
 العربية ar
 বাংলা bn
 Deutsch de
 Filipino fil
 Français fr
 हिन्दी hi
 Bahasa Indonesia id
 Italiano it
 Русский ru
 Svenska sv
 ไทย th
 Türkçe tr
 Tiếng Việt vi
 简体中文 zh
Updated:
IndicatorsOverbought and Oversold in the Stochastic Oscillator: How to Spot Them
 Naomi TanakaEditorial character · Analysis Desk

Quick answer
In the stochastic oscillator, overbought is a reading above 80 and oversold, below 20: the close sat near the top or the bottom of the price range over the last 14 periods. These zones describe where the price is, not where it's going. In a strong trend, the stochastic can stay above 80 or below 20 for weeks, so the signal is usually the zone exit or the %K/%D crossover, not simply entering the zone.
Overbought and oversold are among the most repeated expressions in technical analysis, and the stochastic oscillator is one of the most direct ways to measure them. The problem is that many people translate those words as expensive and cheap, buy and sell, when the indicator is saying something else.
In this guide we use real daily Apple (AAPL, Yahoo Finance data) quotes between April and October 2026, with the standard 14,3 stochastic, to show the calculation and what the price actually did after each pass through the 80 and 20 zones.
What Overbought and Oversold Mean in the Stochastic
The stochastic compares the close with the recent price range. It has two lines from 0 to 100: %K, which is the close's position within the range between the highest high and the lowest low of the last 14 candles, and %D, a 3-period average of %K.
- Above 80 (overbought): the close sat in the top 20% of the range. Buyers have been in control.
- Below 20 (oversold): the close sat in the bottom 20%. Sellers have been in control.
- Between 20 and 80: the neutral zone, where the price moves around the middle of the range.
Some traders use 70 and 30 to get more signals, or 90 and 10 to get only the extremes. The logic is the same.

How to Calculate the Stochastic
- %K = 100 × (close − lowest low of 14) ÷ (highest high of 14 − lowest low of 14)
- %D = average of the last 3 %K values
Example with Real Apple Data
On June 25, 2026, Apple closed at $275.15, after falling $17.93 in a single trading day. The 14 candles considered span from June 5 to June 25.
- Highest high of the period: $317.40 (June 8)
- Lowest low of the period: $273.75 (June 25)
- %K = 100 × (275.15 − 273.75) ÷ (317.40 − 273.75) = 100 × 1.40 ÷ 43.65 = 3.2
- %D = (23.1 from June 23 + 19.0 from June 24 + 3.2 from June 25) ÷ 3 = 15.1
It was the lowest %K reading in the entire period: the stock closed practically at the low of the previous three weeks.
Real Example: Overbought and Oversold in Apple in 2026
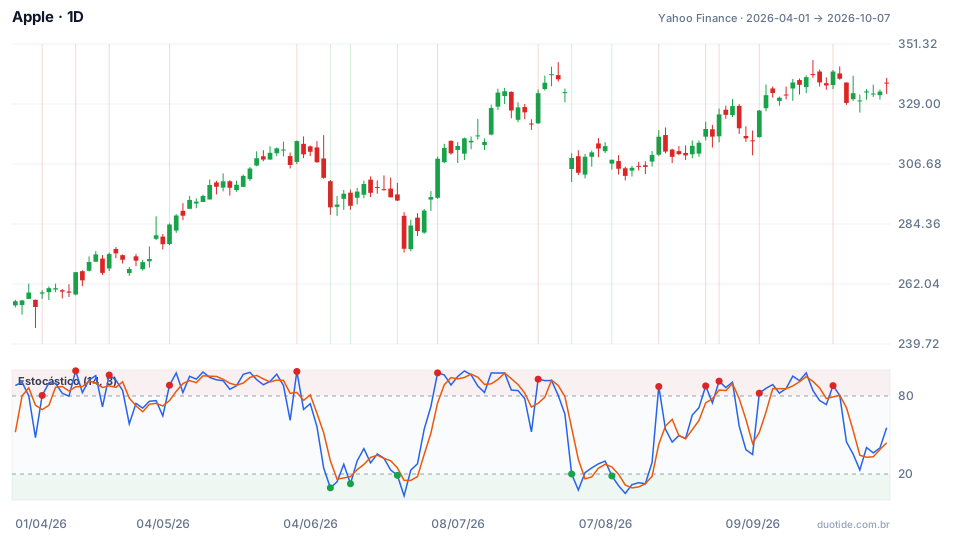
In the chart, Apple starts at $255.63 on April 1, 2026 and reaches $336.67 on October 7, 2026, a 31.7% gain, with a low of $245.70 on April 7 and a high of $345.34 on September 22. In an uptrend like this, %K crossed above 80 on 13 occasions and below 20 on only 5. Four moments show how to read these zones.
May: 18 Straight Trading Days in Overbought
From May 5 to May 29, %K closed above 80 on all 18 trading days. Over that span the stock went from $284.18 to $312.06, a 9.8% gain. Anyone who sold on the first overbought day would have missed out on the entire month. In an uptrend, staying near the top of the range is exactly what the price does.
June: The First Oversold Reading Didn't Mark the Bottom
On June 9, %K fell to 9.4 with the stock at $290.55, after having been at 98.9 a week earlier ($315.20 on June 2). Anyone who bought there because of the oversold reading saw the price swing and then fall to $275.15 on June 25, 5.3% lower. An oversold reading indicates a sharp decline, not that the decline is over.
Late June: Exiting Oversold and a Quick Rally
The day after the 3.2 reading, on June 26, %K rose to 23.0, exited the oversold zone, and crossed above %D (15.1), with the close at $283.78. By July 2, Apple was already at $308.63, 12.2% above the June 25 close, and %K had climbed to 97.8. The zone exit with a crossover was a more useful signal than entering the zone.
August: A Long Oversold Stretch with No Further Decline
On July 31, the stock fell from $333.43 to $308.91 in one trading day, and %K collapsed from 65.9 to 20.0, reaching 7.7 on August 3. Over the following two weeks the indicator stayed almost entirely below 30, but the price moved sideways between $302.25 and $313.33. On August 19 the stock closed at $316.83 and %K jumped to 87.3. Persistent oversold readings, here, meant the price was stuck near the low, not that the decline was continuing.

How to Use Overbought and Oversold in the Stochastic
Read the Zone Along with the Trend
In an uptrend, like Apple's in this period, readings above 80 are normal and drops below 20 tend to be brief; use oversold as a point of buying interest and ignore overbought as a sell signal. In a downtrend, do the opposite. A 50- or 200-period moving average helps you know which side you're on.
Wait for the Zone Exit
Instead of acting when %K enters oversold, wait for it to move back above 20, preferably crossing %D. The signal lags by one or two candles, but it avoids buying in the middle of a decline like June's.
Divergences in the Extreme Zones
If the price makes a higher high and the stochastic makes a lower peak inside overbought, the rally is losing strength. On September 22, Apple marked the period's high, $345.34, but the September 25 %K (88.0) had already fallen below the 97.8 of September 21. In the following weeks the stock closed between $329.40 and $336.67. The divergence warns; it doesn't give the date.
Limitations
The stochastic only looks at the high, the low, and the close of the last 14 candles. A single very large bar, like the one on July 31, changes the entire range and can keep the indicator low for weeks. It also doesn't take into account volume, news, or company earnings.
Common Mistakes with Overbought and Oversold
- Reading overbought as expensive and oversold as cheap: the indicator measures the position within the recent range, not the asset's value.
- Selling as soon as %K crosses above 80 in an uptrend, as in May.
- Buying the first oversold reading after a sharp decline, without waiting for a reaction signal.
- Changing the levels (from 80 and 20 to 70 and 30, for example) without testing the effect on the number of signals.
- Forgetting that the examples above describe what happened, not what will happen.
To practice, open the daily chart of a stock you follow in your demo account, add the 14,3 stochastic, and note down, over a few weeks, what the price did after each entry into and each exit from the 80 and 20 zones. With that record you'll find out which reading works best for the asset you trade.
Practice before you risk. Open your Duotide account and test your ideas on the demo account with US$10,000 in virtual funds.
Create free accountUpdated:
Editorial character of the Duotide newsroom. Articles are written by the team with the help of artificial intelligence; prices and charts come from real market data. Explains charts, indicators and trading strategies: how they work, where they fail and how to test them first.
Was this article helpful?
Be the first to rate it.
Comments
- No comments yet. Be the first to comment.
Ready to put it into practice?
Open your account and practice on the demo account with US$10,000 in virtual funds, without risking money.
- Secure platformProtected login and identity verification
- Multilingual supportHelp available every day
- Free demo accountUS$10,000 virtual to practice
Trading involves the risk of losing the capital invested.
