

 Português pt
 Español es
 العربية ar
 বাংলা bn
 Deutsch de
 Filipino fil
 Français fr
 हिन्दी hi
 Bahasa Indonesia id
 Italiano it
 Русский ru
 Svenska sv
 ไทย th
 Türkçe tr
 Tiếng Việt vi
 简体中文 zh
Updated:
Risk managementTrailing Stop: How to Use It Without Cutting Gains Short
 Camila NascimentoEditorial character · Risk & Behavior Desk

Quick answer
The trailing stop is a stop that rises along with the price, keeping a fixed distance from the highest level reached, and stays put when the price pulls back. To avoid exiting too early, the distance needs to be bigger than the asset's normal swing, and a practical way to measure that swing is the ATR. A short distance protects more profit, but gets triggered by any ordinary pullback.
The trailing stop is one of the most useful tools for protecting profit without watching the chart all the time. Instead of a fixed stop, it follows the price in the trade's favor and locks in part of the gain as the move progresses. The problem is that, poorly calibrated, it closes winning trades on the first ordinary pullback and takes you out of a move that still had room left.
In this guide, we simulate trailing stops with different distances on Nvidia's (NVDA) real daily quotes between March and October 2026, to show in practice what changes when the distance is short or wide.
What a trailing stop is
A trailing stop is defined by a distance, in percent, in a dollar amount, or in multiples of volatility, relative to the most favorable price the trade has reached. On a long, if the price makes a new high, the stop rises and keeps that distance. If the price pulls back, the stop stays put at the last level. When the price comes back down to it, the position closes.
It doesn't replace the initial stop loss. The initial stop sets the entry's maximum risk; the trailing stop comes into play to protect the profit that's already shown up. On most platforms, the trailing starts exactly at the initial stop's point and climbs from there.

How to calculate the trailing stop's distance with the ATR
The most common distance among beginners is a fixed percentage, like 3%. The flaw is that 3% can be too much for a calm asset and too little for an agitated one. The ATR (average true range) fixes this by measuring how much the asset swings, on average, per day. The rule becomes: stop = highest price since entry − (k × ATR), with k usually between 2 and 4.
Example with real numbers: on March 31, 2026, NVDA closed at $174.40, and the 14-day ATR was at $5.84.
- 1 × ATR: a distance of $5.84, initial stop at $168.56.
- 2 × ATR: a distance of $11.67, initial stop at $162.73.
- 3 × ATR: a distance of $17.51, initial stop at $156.89.
- 4 × ATR: a distance of $23.35, initial stop at $151.05.
The distance also sets the position size. Anyone willing to lose $200 per trade can buy 34 shares with the 1 × ATR stop (200 ÷ 5.84 = 34.2) and only 11 with the 3 × ATR stop (200 ÷ 17.51 = 11.4). A wider stop doesn't mean a bigger dollar risk, as long as the position is smaller.
Real example: a trailing stop on Nvidia in 2026
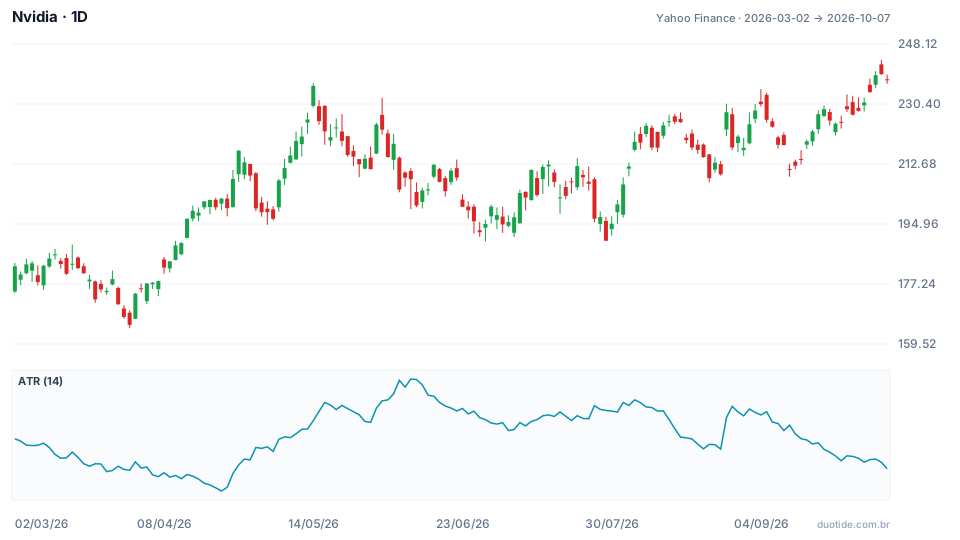
The panel below shows NVDA's 14-day ATR. It ranged from $4.88 (April 22) to $8.56 (June 9): the same stock swung almost twice as much in June as in April. A fixed-dollar stop would have been too tight in one month and too loose in the other. We simulated the trailing stop with the distance calculated from the entry day's ATR, applied to the daily highs and lows.
Entry on March 31: the short stop exited before the rally
At 1 × ATR, April 1's high ($177.37) pushed the stop to $171.53, and April 2's low ($171.37) triggered it: a loss of $2.87 per share, or 1.6%. A 3% trailing stop met the same fate, exiting at $172.05. Over the next three weeks, NVDA rose to $216.83 on April 27.
At 2 × ATR, the stop followed the rally up to $205.16 and was triggered on April 30, when the low was $198.70: a gain of $30.76, or 17.6%. At 3 × ATR, the exit came the same day, at $199.32, a gain of 14.3%. At 4 × ATR, the stop ($193.48) survived the early-May correction, whose low was $194.74 on May 4, and the trade caught the following rally up to $236.54 on May 14. The stop rose to $213.19 and was triggered on May 26: a gain of $38.79, or 22.2%.
Entry on July 2: the wide stop gave it all back
NVDA closed at $194.83, with an ATR of $7.12. This time the outcome flipped. At 1 × ATR, the exit came on July 13 at $203.88, a gain of 4.6%. At 2 × ATR, on July 17, a gain of 2.4%. At 3 × ATR, the rally up to $214.39 wasn't enough to move the stop away from the entry, and the exit on July 28 at $193.02 produced a 0.9% loss. The 4 × ATR stop, meanwhile, was still open on October 7, with the stop at $214.87 and the stock at $237.47.
The lesson from both cases: no distance wins every time. A short stop wins on short moves and loses on long ones; a wide stop does the opposite. What you can control is making sure the distance respects the asset's normal swing and matches the type of move you want to capture.

How to use the trailing stop
Set the distance based on volatility
Use the ATR from the timeframe you trade on. On the daily, 2 to 3 × ATR is a common starting point for trades lasting a few weeks; for day trades, the reference is the ATR from the minute chart, not the daily one.
Adjust to the trade's horizon
Anyone looking for moves lasting a few days can accept shorter stops and frequent exits. Anyone wanting to follow trends lasting months needs a bigger distance and the stomach to give back part of the profit during corrections.
Consider activating the trailing stop only after a minimum profit
Right after entry, noise weighs more relative to the move. One alternative is to keep the initial stop fixed until the trade advances, say, 1 × ATR in your favor, and only then start raising the stop.
Choose the reference price
Some platforms move the stop based on the candle's high; others, on the close. Based on the close, the stop rises more slowly and is less affected by a single day's spike. Know which rule your platform uses before comparing results.
Limitations
The trailing stop doesn't guarantee the exit price: if the asset opens with a gap below the stop, the order gets filled at the available price, which can be much worse. In a sideways market, it tends to get triggered repeatedly with no meaningful gain. And the simulation above uses past data from a single asset; a different period or a different asset would give different numbers.
Common mistakes when using a trailing stop
- Using a distance smaller than the asset's normal daily swing: on April 2, a 1 × ATR stop got triggered by an ordinary swing.
- Applying the same percentage to every asset, ignoring that each one has different volatility.
- Tightening the stop manually out of anxiety when the price gets close to it, changing the rule in the middle of the trade.
- Moving the stop farther away to avoid getting triggered, which turns profit protection into a bigger loss.
- Choosing the distance by looking at a single past example where it worked well.
- Forgetting to reduce the position size when the stop gets wider.
To train, open a demo account, pick an asset, calculate the ATR, and test two different distances on simulated trades over a few weeks. Write down where each stop would have exited and how much of the move it captured. Your record will show which distance fits your style, without risking money.
Practice before you risk. Open your Duotide account and test your ideas on the demo account with US$10,000 in virtual funds.
Create free accountUpdated:
Editorial character of the Duotide newsroom. Articles are written by the team with the help of artificial intelligence; prices and charts come from real market data. Writes about risk management, position sizing and the psychology behind traders' decisions.
Was this article helpful?
Be the first to rate it.
Comments
- No comments yet. Be the first to comment.
Ready to put it into practice?
Open your account and practice on the demo account with US$10,000 in virtual funds, without risking money.
- Secure platformProtected login and identity verification
- Multilingual supportHelp available every day
- Free demo accountUS$10,000 virtual to practice
Trading involves the risk of losing the capital invested.
