

 Português pt
 Español es
 العربية ar
 বাংলা bn
 Deutsch de
 Filipino fil
 Français fr
 हिन्दी hi
 Bahasa Indonesia id
 Italiano it
 Русский ru
 Svenska sv
 ไทย th
 Türkçe tr
 Tiếng Việt vi
 简体中文 zh
Updated:
StrategiesTrend Following or Mean Reversion: Which to Use
 Naomi TanakaEditorial character · Analysis Desk

Quick answer
Trend following means entering in favor of a move that's already started and staying in it for as long as it lasts; mean reversion means betting that a price that's strayed too far from a reference will come back near it. The first works in markets with a clear direction, the second in sideways markets. The key is recognizing which of the two regimes the asset is in before choosing the approach.
A good part of trading strategies are born from a basic choice: believe the price will keep moving in the same direction, or bet that it will snap back after an overdone move. These are opposite philosophies, and using the right tool in the wrong market is one of the most common causes of frustration for beginners.
In this guide, we use the Ibovespa's real daily quotes between March and October 2026, with the ADX in the panel below, to show how the same index went through trending and sideways phases, and what each approach would have faced in each one.
What trend following is
Trend followers start from the idea that an asset already rising has a better chance of keeping on rising than suddenly reversing, and the same goes for a decline. The goal isn't to buy the bottom or sell the top, but to enter during the move and stay in it for as long as the trend holds.
Typical signs of a trending market:
- Breakouts that close outside the previous range without quickly snapping back inside.
- Shallow pullbacks that don't break the sequence of highs and lows.
- Short- and medium-term moving averages sloping in the same direction.
- ADX above 25, indicating the directional move has gained strength.

What mean reversion is
Mean reversion traders start from the opposite principle: when the price strays too far from a reference, like a moving average or the center of a range, the odds of it pulling back toward it increase. This approach works best in markets with no clear direction, where the price goes back and forth within a range.
Signs of a market that favors reversion:
- Supports and resistances respected several times over.
- Breakout attempts that fail and snap back inside the range.
- Oscillators like the RSI reaching extremes without the price leaving the range.
- ADX below 20, indicating a lack of direction.
How the ADX helps tell the two regimes apart
The ADX measures the strength of the trend, not its direction, on a scale from 0 to 100. Direction comes from the +DI (green on the chart) and −DI (red) lines: when the +DI is higher, buying pressure dominates; when the −DI is higher, selling pressure does. A common reading treats an ADX above 25 as a trending market and below 20 as a sideways market, with the range in between as a transition zone.

Real example: the Ibovespa in 2026
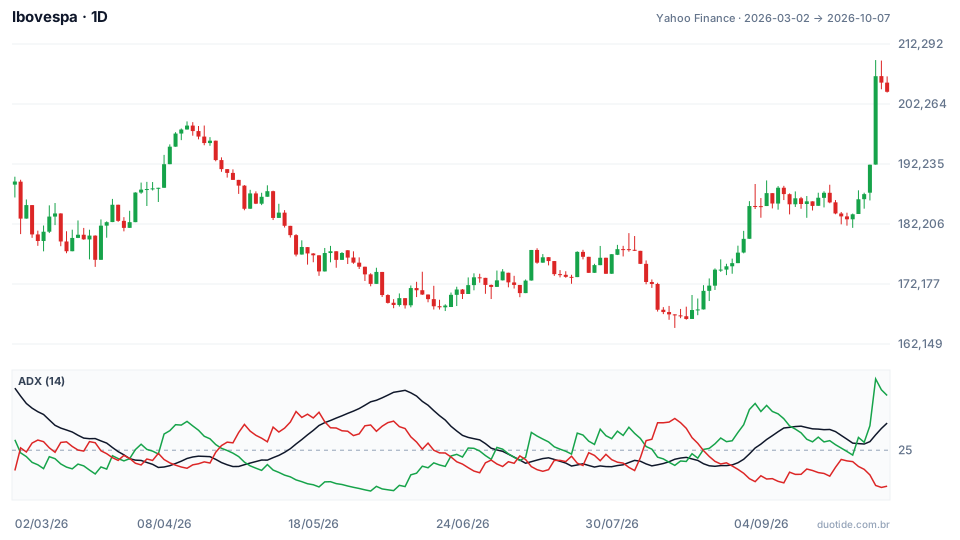
Between March and October 2026 the Ibovespa went through three quite different phases, and each one punished one of the two approaches.
May and June: a downtrend, bad for those buying the oversold
On May 12 the ADX passed 25 (25.6) with the −DI at 36.9 and the +DI at 13.7: a downtrend gaining strength, with the index at 180,342 points. The next day the 14-period RSI reached 30.8, near oversold, with the index at 177,098. Anyone who bought there betting on a return to the mean watched the Ibovespa fall to 169,019 on June 5, another 4.6%. The ADX kept climbing to 50.3 on June 10. For a trend follower, shorting on May 12 and still being positioned on June 8 (168,669) meant a 6.5% drop in the trade's favor.
July and August: sideways, bad for those buying breakouts
From July 8 to August 31 the ADX swung between 17.9 and 22.0, never reaching 25, and the index's closes stayed between 166,335 and 178,000 points, a 7% range. On July 10 the Ibovespa rose 3.0% and closed at 177,866, looking like a breakout; by July 20 it was already at 173,371, 2.5% lower. On August 4 the high was 180,680, but the close came in at 177,895, and ten days later the index was at 166,934. Anyone who bought those breakout attempts piled up losses.
For mean reversion, the same phase was favorable: on August 14 the index closed at 166,934, 4.0% below the 20-day average (173,961), with the RSI at 32.7. Seven sessions later, on August 25, it closed at 174,577, up 4.6%, back above the average.
September and October: a new trend, bad for those shorting the overbought
On September 2 the index rose 3.05% and closed at 185,205, above the entire July-August range. The ADX passed 25 the next day (25.9), with the +DI at 44.8. The RSI was at 76.9, classic overbought. Anyone who shorted there expecting a return to the mean watched September's pullback stop at 182,991 on September 28, never going back into the old range, followed by a 7.7% rally in a single day on October 5, with a high of 209,606. On October 7 the index closed at 204,302, 10.3% above the September 2 close.
The three examples describe what happened in that period; they show the pattern, they don't guarantee it will repeat.
How to use each approach
Identify the regime before entering
Before every trade, answer: is the market moving in a clear direction, or stuck in a range? The ADX, the slope of the moving averages, and the sequence of highs and lows help answer that. If the answers disagree, the market is in transition, and cutting exposure is usually the more prudent move.
Risk management changes with the approach
In trend following, the stop sits farther away to let the move breathe, the win rate tends to be lower, and the result depends on a few big wins. In mean reversion, the stop is tighter and the target closer, usually the mean itself or the other side of the range, with more wins and smaller gains.
Have a rule for switching
Mixing the two without a rule is the worst path: buying every dip in a downtrend, or chasing every breakout in a sideways market. If you use both, write down which condition activates each one, for example, mean reversion only with the ADX below 20 and trend following only above 25.
Limitations
The ADX is calculated from averages and reacts with a lag: on September 2 the breakout had already happened by the time it passed 25. Regimes also shift without warning, and the July-August sideways phase turned into a trend within a few days. Neither approach works all the time, and both go through losing streaks when applied in the wrong regime.
Common mistakes when choosing between trend following and mean reversion
- Buying the RSI's oversold reading inside a strong downtrend, as in May 2026.
- Chasing every breakout in a sideways market, as in July and August.
- Shorting the overbought right after a confirmed breakout, as in September.
- Using a mean-reversion stop that's too tight on a trend trade, or a wide stop on a mean-reversion trade.
- Switching approaches in the middle of a losing streak, with no defined rule.
- Forgetting that there's loss risk in any approach: no strategy eliminates that risk.
To train, use a demo account and test each approach separately over a few weeks, noting the ADX at the time of each trade and whether the market was trending or sideways. That record shows which regime each style worked in for you, without risking money.
Practice before you risk. Open your Duotide account and test your ideas on the demo account with US$10,000 in virtual funds.
Create free accountUpdated:
Editorial character of the Duotide newsroom. Articles are written by the team with the help of artificial intelligence; prices and charts come from real market data. Explains charts, indicators and trading strategies: how they work, where they fail and how to test them first.
Was this article helpful?
Be the first to rate it.
Comments
- No comments yet. Be the first to comment.
Ready to put it into practice?
Open your account and practice on the demo account with US$10,000 in virtual funds, without risking money.
- Secure platformProtected login and identity verification
- Multilingual supportHelp available every day
- Free demo accountUS$10,000 virtual to practice
Trading involves the risk of losing the capital invested.
