

 Português pt
 Español es
 العربية ar
 বাংলা bn
 Deutsch de
 Filipino fil
 Français fr
 हिन्दी hi
 Bahasa Indonesia id
 Italiano it
 Русский ru
 Svenska sv
 ไทย th
 Türkçe tr
 Tiếng Việt vi
 简体中文 zh
Updated:
IndicatorsWhat Bollinger Bands Are and How to Calculate Them
 Naomi TanakaEditorial character · Analysis Desk

Quick answer
Bollinger Bands are a channel made of a 20-period simple moving average and two lines set 2 standard deviations above and below it. They measure volatility and how stretched the price is relative to its own average. Touching or closing outside a band isn't an automatic reversal signal: in a strong trend, the price can ride right along a band for several days.
Created by John Bollinger in the 1980s, the bands show up on practically every charting platform, and almost every beginner learns the same simplified rule: touches the top, sell; touches the bottom, buy. That rule ignores what the indicator actually measures.
In this guide we use the S&P 500's real daily quotes between April and October 2026 to show the calculation and what actually happened at the band touches and the channel squeeze.
What Bollinger Bands Are
The indicator has three lines. The middle one is a simple moving average, usually 20 periods. The outer ones sit at a distance of 2 standard deviations from that average. Standard deviation measures how spread out prices are around the average: on choppy days it grows and the bands pull apart; on calm days it shrinks and the bands pull together.
That's why the bands do two things at once: they show recent volatility (through the channel's width) and show how far the current price is from its normal behavior (through its position relative to the bands).

How to Calculate Bollinger Bands
- Middle band: the simple average of the last 20 closes.
- Standard deviation: the square root of the average of the squared differences between each close and the average.
- Upper band: average + 2 × standard deviation.
- Lower band: average − 2 × standard deviation.
Example With Real S&P 500 Data
We took the 20 daily closes from 09/10/2026 to 10/07/2026. The lowest was 7,551.81 points (09/16) and the highest, 7,818.93 (10/06).
- Average of the 20 closes: 7,688.36
- Standard deviation: 72.11
- Upper band: 7,688.36 + 2 × 72.11 = 7,832.58
- Lower band: 7,688.36 − 2 × 72.11 = 7,544.14
The channel was 288.44 points wide, or 3.75% of the average. The 10/07 close, 7,801.77, sat inside the channel, near the upper band. Some platforms use the sample standard deviation (dividing by 19 instead of 20), which widens the bands slightly; the reading doesn't change.
Real Example: the Bands on the S&P 500 in 2026
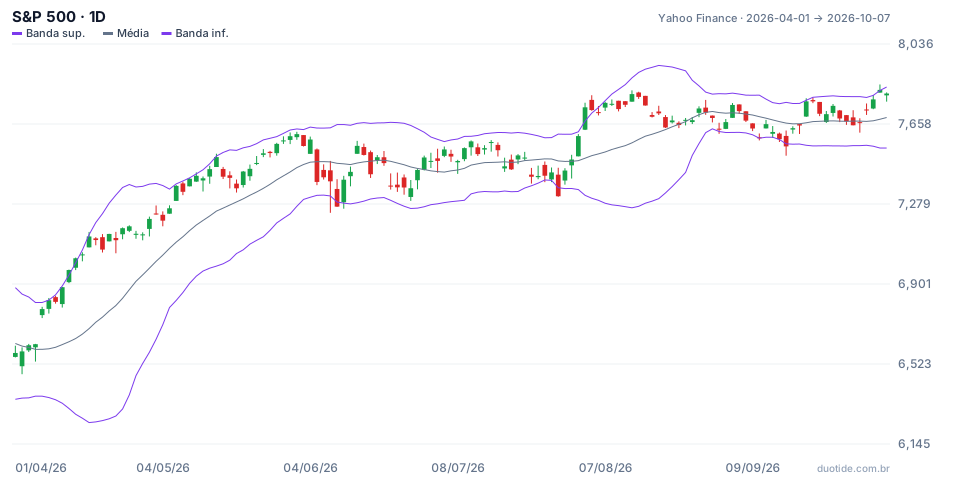
Over the period, the index rose from 6,575.32 points (04/01) to 7,801.77 (10/07), up 18.7%. Across 131 sessions, the close sat outside the bands only 8 times, about 6% of the days. Three stretches show well how to read the indicator.
April: Price Riding the Upper Band
On 04/14 the S&P 500 closed at 6,967.38, above the upper band (6,943.79), and did it again the next day, at 7,022.95. Anyone selling because it looked stretched would have fought the rally: ten sessions after 04/14 the index was 2.5% higher, and on 04/30 it closed at 7,209.01. The channel's width reached 15.4% of the average on 04/23, the period's highest value. In a strong trend, closing above the band shows strength, not exhaustion.
June and July: Touches on the Lower Band
On 06/10 the index closed at 7,266.99, below the lower band (7,288.86), and ten sessions later it was 1.3% higher. On 07/29 it closed at 7,316.15, below the lower band (7,356.35), and ten sessions later it was 5.9% higher. In a market with an underlying uptrend, the touches on the lower band worked as pullbacks. This describes what happened in this period, not a rule that always repeats.
September: the Squeeze and Moves in Both Directions
On 08/31 the channel's width dropped to 2.13% of the average, the window's lowest, with the index at 7,686.14. The squeeze preceded a move, but it didn't tell the direction: first the index fell and closed 09/16 at 7,551.81, below the lower band (7,563.95); then it rose and closed 10/06 at 7,818.93, above the upper band (7,816.09). Anyone betting on one side right after the squeeze would have been right or wrong depending on the timing of the entry.

How to Use Bollinger Bands
In a Sideways Market
When the price oscillates with no direction, touches on the bands tend to mark the range's extremes, and a return to the average is more likely. This is the mean-reversion use, and it works best with confirmation, like a rejection candle.
In a Trend
In a trend, the band becomes a strength reference. Repeated closes near the upper band show a healthy rally; pullbacks to the middle average can work as a point of interest in the direction of the trend, as in April.
Squeeze
Very tight bands signal low volatility, which tends to be followed by higher volatility. Use the squeeze as a heads-up that something is about to move, and wait for a confirmed breakout to know the direction.
Limitations
The bands are calculated only from past prices, so they lag during sharp changes. The idea that 95% of prices stay within 2 deviations comes from the normal distribution, and markets have extreme moves more often than that distribution predicts. Adjusting the period and the multiplier changes the number of touches: test it on the asset before changing it.
Common Mistakes With Bollinger Bands
- Selling every touch on the upper band and buying every touch on the lower one, without checking the trend.
- Treating the squeeze as a directional signal, when it only announces rising volatility.
- Using the bands alone, without support, resistance, or volume.
- Comparing band width between assets with very different volatilities.
- Forgetting that the examples describe what happened, not what will happen.
To practice without risking money, open an index's daily chart in a demo account, add the 20-period, 2-deviation bands, and note, over a few weeks, what the price did after each close outside the channel and each squeeze. The record will show whether the indicator helps on the asset and timeframe you trade.
Practice before you risk. Open your Duotide account and test your ideas on the demo account with US$10,000 in virtual funds.
Create free accountUpdated:
Editorial character of the Duotide newsroom. Articles are written by the team with the help of artificial intelligence; prices and charts come from real market data. Explains charts, indicators and trading strategies: how they work, where they fail and how to test them first.
Was this article helpful?
Be the first to rate it.
Comments
- No comments yet. Be the first to comment.
Ready to put it into practice?
Open your account and practice on the demo account with US$10,000 in virtual funds, without risking money.
- Secure platformProtected login and identity verification
- Multilingual supportHelp available every day
- Free demo accountUS$10,000 virtual to practice
Trading involves the risk of losing the capital invested.
