

 Português pt
 Español es
 العربية ar
 বাংলা bn
 Deutsch de
 Filipino fil
 Français fr
 हिन्दी hi
 Bahasa Indonesia id
 Italiano it
 Русский ru
 Svenska sv
 ไทย th
 Türkçe tr
 Tiếng Việt vi
 简体中文 zh
Updated:
IndicatorsWhat Is the MACD and How to Use It
 Naomi TanakaEditorial character · Analysis Desk

Quick answer
The MACD is a trend and momentum indicator made of the difference between the 12- and 26-period exponential moving averages, a signal line (a 9-period average of the MACD), and a histogram. The MACD crossing above the signal line suggests bullish momentum, and below it, bearish. Since it's built from moving averages, the indicator always lags and produces false signals in a sideways market.
The MACD is one of the most popular indicators because it brings together, in a single panel, two pieces of information a trader wants to know at the same time: which way the trend points and whether it's gaining or losing strength. It was created by Gerald Appel in the late 1970s, and the histogram that now accompanies the indicator was added later, in 1986, by Thomas Aspray.
In this guide we use Apple's real daily stock quotes (AAPL, Yahoo Finance data) between April and October 2026 to show the calculation and what each crossover actually delivered over this period.
What the MACD Is
MACD stands for Moving Average Convergence Divergence. The indicator has three parts:
- MACD line: the difference between the 12-period and the 26-period exponential moving average (EMA).
- Signal line: a 9-period EMA of the MACD line itself.
- Histogram: the MACD line minus the signal line.
When the short average is above the long one, the MACD is positive and the price has been rising faster in the short term. When the distance between the averages grows, they diverge; when it shrinks, they converge. Hence the name.

How to Calculate the MACD
First calculate the two exponential averages of the close. The EMA gives more weight to recent prices: the new value is (today's price − yesterday's EMA) × 2 ÷ (N + 1) + yesterday's EMA. Then do the subtractions.
Example With Real Apple Data
On 10/07/2026 AAPL closed at $336.67. That day:
- 12-day EMA = 333.88
- 26-day EMA = 330.61
- MACD line = 333.88 − 330.61 = 3.27
- Signal line (9-day EMA of the MACD) = 4.09
- Histogram = 3.27 − 4.09 = −0.82
The reading: the short average was above the long one (positive MACD, bullish bias), but the MACD was below its signal line (negative histogram), meaning short-term momentum had been losing strength. Notice that the MACD is measured in dollars, not on a fixed scale: a MACD of 3 on Apple doesn't compare to a MACD of 3 on bitcoin.
Real Example: Apple's MACD in 2026
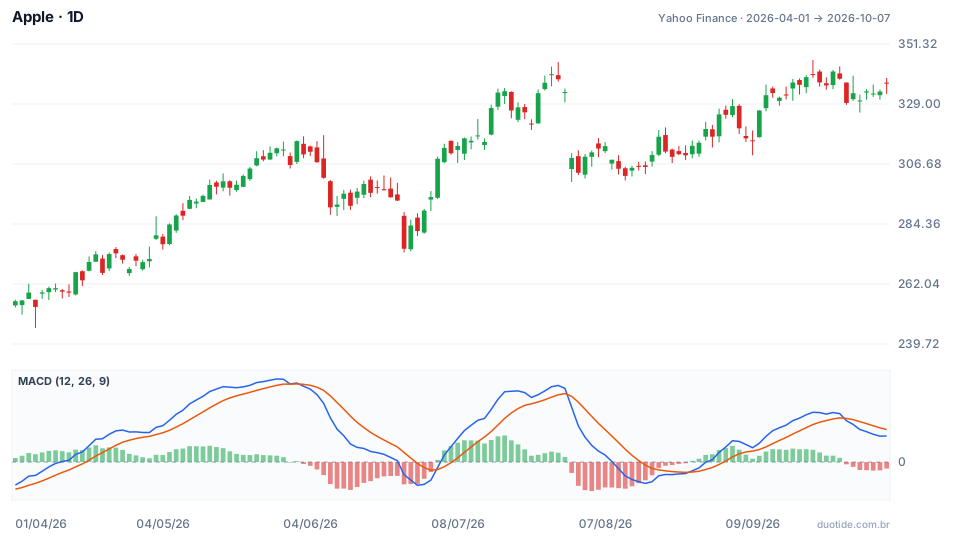
In the chart, the blue line is the MACD, the orange one is the signal line, and the bars are the histogram. Between 04/01 ($255.63) and 10/07 ($336.67) the stock rose 31.7%. Over the period there were five crossovers between the MACD and the signal, and they tell a more varied story than the theory suggests.
June and July: Two Crossovers That Worked
On 06/03 the MACD crossed below the signal line with the stock at $310.26. Ten sessions later it stood at $295.95 (−4.61%), and the lowest close of that drop came on 06/25, at $275.15. On 07/02 came the bullish crossover, with the price at $308.63; ten sessions later, $333.74 (+8.14%), and the close reached $340.08 on 07/28.
One detail shows the indicator's lag: the MACD line only dropped below zero on 06/25, exactly the day of the drop's lowest close. Anyone waiting for a negative MACD to sell would have sold at the bottom.
July 31: the Signal That Arrived After the Gap
On 07/31 Apple opened at $304.81, 8.58% below the previous close of $333.43, and the bearish crossover showed up that same day, with a close at $308.91. The drop had already happened. In the following weeks the stock traded sideways, between $302.25 (08/12) and $316.83 (08/19), and the signal delivered only −0.96% over ten sessions.
September: a Divergence and a Signal That Failed
On 07/17 the MACD stood at 8.82 with the stock at $333.74. On 09/22 the price closed higher, at $339.75, but the MACD was only at 6.25. A price making a higher high while the MACD makes a lower high is a bearish divergence. On 09/29 came the bearish crossover, at $329.40. Through 10/07, instead of falling, the stock rose 2.21%, to $336.67. The divergence warned of a loss of strength; it didn't guarantee a drop.

How to Use the MACD
The Crossover With the Signal Line
The MACD crossing above the signal suggests bullish momentum; below it, bearish. It's the indicator's fastest signal, and also the one that fails most in a sideways market, as in August. It works best when it agrees with the bigger trend.
The Zero-Line Crossover
A MACD above zero means the 12-period average is above the 26-period. It's a slower signal, more useful as a trend filter than as a trigger: in 2026, AAPL spent most of the time with a positive MACD, consistent with the period's rally.
The Histogram
The bars show the distance between the MACD and the signal. When they start shrinking, a crossover is getting close. Many traders use the histogram to spot a loss of strength a few days before the crossover itself.
Divergences
As in the September example, divergences show that the price keeps moving with less momentum behind it. They're most useful on daily and weekly charts, and near significant support and resistance levels.
Limitations
The MACD is built from moving averages, so it always lags. It doesn't react to news gaps before they happen, it generates many false crossovers in sideways markets, and it has no fixed overbought or oversold levels, because its value depends on the asset's price.
Common Mistakes When Using the MACD
- Trading every crossover with the signal line without checking whether the market is trending or sideways.
- Comparing the MACD's value between assets with different prices, as if it were a 0-to-100 scale.
- Treating a divergence as a sell order: in September, the stock rose after the signal.
- Changing the 12, 26, and 9 parameters without testing first, just to make the indicator look faster.
- Forgetting that the examples above describe what happened in the period, not what will happen.
To practice without risking money, open an asset's chart in a demo account, add the MACD with the default parameters, and note every crossover for a few weeks: date, price, whether the market was trending, and where the price stood ten sessions later. Your own record quickly shows which situations the signal helps in and which it gets in the way of.
Practice before you risk. Open your Duotide account and test your ideas on the demo account with US$10,000 in virtual funds.
Create free accountUpdated:
Editorial character of the Duotide newsroom. Articles are written by the team with the help of artificial intelligence; prices and charts come from real market data. Explains charts, indicators and trading strategies: how they work, where they fail and how to test them first.
Was this article helpful?
Be the first to rate it.
Comments
- No comments yet. Be the first to comment.
Ready to put it into practice?
Open your account and practice on the demo account with US$10,000 in virtual funds, without risking money.
- Secure platformProtected login and identity verification
- Multilingual supportHelp available every day
- Free demo accountUS$10,000 virtual to practice
Trading involves the risk of losing the capital invested.
