

 Português pt
 Español es
 العربية ar
 বাংলা bn
 Deutsch de
 Filipino fil
 Français fr
 हिन्दी hi
 Bahasa Indonesia id
 Italiano it
 Русский ru
 Svenska sv
 ไทย th
 Türkçe tr
 Tiếng Việt vi
 简体中文 zh
Updated:
IndicatorsWhat Is the RSI (Relative Strength Index) and How to Calculate It
 Naomi TanakaEditorial character · Analysis Desk

Quick answer
The RSI (Relative Strength Index) is a momentum indicator that ranges from 0 to 100 and compares the average gain with the average loss over the last periods, typically 14. Above 70 signals overbought; below 30, oversold. Neither reading is an automatic reversal signal: in a strong trend, the RSI can sit in those zones for days while the price keeps moving.
The RSI, short for Relative Strength Index, was created by J. Welles Wilder in 1978 and remains one of the most used indicators on any charting platform. In this guide, instead of made-up examples, we use bitcoin's real daily quotes (BTC/USDT on Binance) between April and October 2026 to show how the indicator is calculated and what it actually showed.
What the RSI Is
The RSI measures the speed and intensity of price moves. It answers a simple question: over the last N periods, which dominated, gains or losses? The result comes out on a scale from 0 to 100. The more gains outweighed losses, the closer to 100; the more losses dominated, the closer to 0.
The standard period is 14 candles. On a daily chart, that means the last 14 sessions; on a 1-hour chart, the last 14 hours.

How to Calculate the RSI
The formula has three steps:
- Average gain: add up the gains from the last 14 periods and divide by 14.
- Average loss: add up the drops (in absolute value) from the same 14 periods and divide by 14.
- RSI = 100 − 100 / (1 + RS), where RS = average gain ÷ average loss.
Example With Real Bitcoin Data
We took BTC/USDT's 15 daily closes from 08/05/2026 ($64,665.23) to 08/19/2026 ($69,334.79). They form 14 moves: 7 up days and 7 down days. 08/19 alone rose $4,609.37, or 7.1%.
- Sum of gains: $7,127.10 → average gain = 7,127.10 ÷ 14 = 509.08
- Sum of losses: $2,457.54 → average loss = 2,457.54 ÷ 14 = 175.54
- RS = 509.08 ÷ 175.54 = 2.90
- RSI = 100 − 100 / (1 + 2.90) = 74.4
Platforms show 73.5 for the same day, not 74.4. The difference comes from Wilder's smoothing: after the first calculation, the new average is (previous average × 13 + today's move) ÷ 14, instead of a simple average of the last 14 moves. That's why the RSI from two platforms can differ slightly early in the series but converges over time.
Real Example: Bitcoin's RSI in 2026
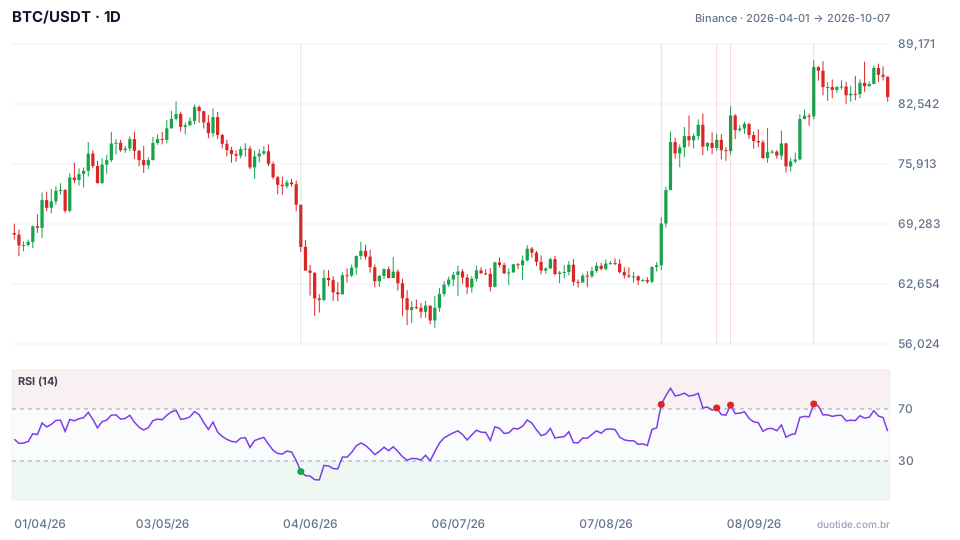
In the chart above, the red dots mark the days the RSI crossed above 70 and the green ones, the days it fell below 30. Three moments show well what the indicator does and doesn't do:
June: Oversold That Didn't Mark the Bottom
On 06/02/2026 the RSI dropped below 30 with BTC at $66,760.83. Anyone buying there because it was "cheap" watched the price fall another 4.8% over the next 10 days; the RSI reached 15.5 on 06/06, and the period's low only came on 07/01, at $57,800.19. Oversold signals a sharp drop, not that the drop is over.
August: Overbought at the Start of a Rally
On 08/19 the RSI crossed above 70 (73.5) with the price at $69,334.79. Over the next 10 days, instead of correcting, BTC rose 12.8%, and the RSI reached 86 on 08/21. Selling just because the indicator was above 70 would have meant exiting right at the start of the move.
September: a Bearish Divergence
On 09/21 the price closed at $86,620, above the 08/21 close ($78,338.03). The RSI, though, sat at 73.9, well below August's 86. A price making a higher high while the RSI makes a lower high is a bearish divergence: the rally was continuing, but with less strength. Over the next two weeks BTC traded sideways between $83,300 and $86,500 and closed 10/07 at $83,321.81, 3.8% below 09/21. The divergence warned of a loss of strength; it didn't predict a big drop.

How to Use the RSI
RSI Above 70
It shows that gains comfortably dominated over the last 14 periods. In a sideways market, it tends to precede corrections; in an uptrend, it can last for days, as in August. Use it as a cue to adjust your stop or avoid buying into an overextended move, not as a sell order.
RSI Below 30
It's the mirror image: drops dominated. In a downtrend, the RSI can stay below 30 for several days in a row, as in June. Wait for the price to show some sign of a reaction (a higher low, a break above a short-term resistance) before treating oversold as an opportunity.
Divergences
A bearish divergence (price rises, RSI makes a lower peak) and a bullish one (price falls, RSI makes a higher low) show the move losing strength. They work best near significant support and resistance levels and on daily or weekly charts; on minute charts they show up all the time and say little.
Combining With the Trend
A simple rule that cuts down on false signals: in an uptrend (price above the 200-period average, for example), use the RSI's pullbacks into the 40-to-50 range as buy points of interest and ignore readings above 70. In a downtrend, do the opposite.
Limitations
The RSI is calculated only from past price: it lags behind sharp changes and knows nothing about news. It also doesn't compare across assets: an RSI of 70 on a volatile cryptocurrency isn't equivalent to an RSI of 70 on a fixed-income bond.
Common Mistakes When Using the RSI
- Automatically selling when the RSI crosses above 70, or buying when it drops below 30, without checking the trend.
- Using the RSI alone, without support, resistance, or volume.
- Changing the period (from 14 to 2 or 5, for example) without testing first: the indicator gets much jumpier and generates far more signals.
- Comparing the RSI across different timeframes as if they were the same reading.
- Forgetting that history doesn't guarantee the future: the examples above describe what happened, not what will happen.
To practice without risking money, open the chart of the asset you follow in a demo account, add the 14-period RSI, and note, over a few weeks, what the price did after every move past 70 and past 30. Your own record is worth more than any ready-made rule.
Practice before you risk. Open your Duotide account and test your ideas on the demo account with US$10,000 in virtual funds.
Create free accountUpdated:
Editorial character of the Duotide newsroom. Articles are written by the team with the help of artificial intelligence; prices and charts come from real market data. Explains charts, indicators and trading strategies: how they work, where they fail and how to test them first.
Was this article helpful?
Be the first to rate it.
Comments
- No comments yet. Be the first to comment.
Ready to put it into practice?
Open your account and practice on the demo account with US$10,000 in virtual funds, without risking money.
- Secure platformProtected login and identity verification
- Multilingual supportHelp available every day
- Free demo accountUS$10,000 virtual to practice
Trading involves the risk of losing the capital invested.
