

 Português pt
 Español es
 العربية ar
 বাংলা bn
 Deutsch de
 Filipino fil
 Français fr
 हिन्दी hi
 Bahasa Indonesia id
 Italiano it
 Русский ru
 Svenska sv
 ไทย th
 Türkçe tr
 Tiếng Việt vi
 简体中文 zh
Updated:
IndicatorsZigZag Indicator: What It Is, How to Set It Up, and Why It Repaints
 Naomi TanakaEditorial character · Analysis Desk

Quick answer
The ZigZag is a filter that connects only the highs and lows where price reversed by more than a minimum threshold, such as 5% or 10%, and ignores smaller swings. It's used to see the chart's structure, measure the size of each leg, and mark support and resistance. It doesn't work as an entry signal: it only confirms a turn after the price has already moved the full threshold, and the last leg can change, or repaint, with every new candle.
Looking at a daily chart with no filter at all is tiring: dozens of small rises and dips compete for attention and hide the move that actually mattered. The ZigZag solves this visual problem by drawing straight lines that connect only the relevant highs and lows, ignoring everything in between.
In this guide we use real daily closing prices for the Ibovespa from March to October 2026 to show how the indicator decides what counts as noise, how long it takes to confirm a high or a low, and why the last leg of the drawing isn't reliable.
What the ZigZag is
The ZigZag isn't an oscillator or a moving average. It's a filter: you set a minimum variation, in percentage or points, and the indicator only draws a new leg when the price moves at least that much in the opposite direction from the last high or low. Moves smaller than the threshold simply don't appear. With a 5% setting, a 3% pullback in the middle of a rally stays invisible.
Some platforms use highs and lows; others use closes only. In this article we use closes, which avoids the ambiguity of sessions where the price makes extreme highs and lows on the same day.

How the ZigZag is calculated
- Start at a point and track the price, keeping the highest close (provisional high) while the leg is rising.
- When a close falls at least X% below the provisional high, that high is confirmed and a downward leg begins.
- In the downward leg, keep the lowest close (provisional low) until a close is X% above it. Then the low is confirmed.
- Repeat. The last leg is always left open.
Example with real Ibovespa data
With a 5% threshold, the Ibovespa marked a high on April 14, 2026, closing at 198,657 points. For that high to be confirmed, a close below 198,657 × 0.95 = 188,724 points was needed. That only happened on April 28, with a close of 188,619, nine sessions after the high.
The other way around, the low of August 18 (166,335 points) required a close above 166,335 × 1.05 = 174,652 points. The first one came on August 27, at 175,135 points, seven sessions later. In both cases, by the time the ZigZag drew the leg, the price was already 5% away from the turning point.
Real example: the ZigZag on the Ibovespa in 2026
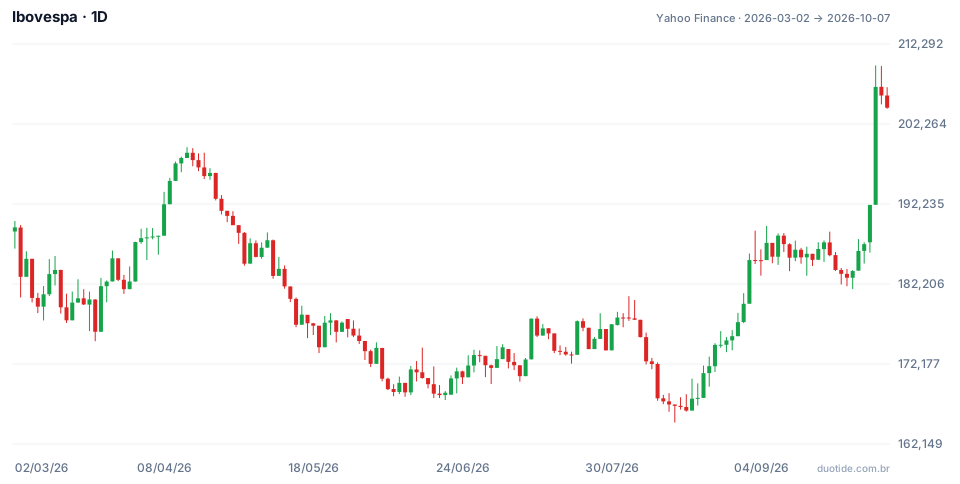
The Ibovespa opened the window at 189,307 points on March 2 and closed October 7 at 204,302, up 7.92% over the period, with an intraday low of 164,835 on August 14. With a 5% threshold on closes, the ZigZag reduces those seven months to six legs:
- High of 189,307 (March 2) to low of 176,219 (March 20): drop of 6.91%.
- Low of 176,219 to high of 198,657 (April 14): rise of 12.73%.
- High of 198,657 to low of 168,278 (June 18): drop of 15.29%.
- Low of 168,278 to high of 178,000 (August 3): rise of 5.78%.
- High of 178,000 to low of 166,335 (August 18): drop of 6.55%.
- Low of 166,335 to the provisional high of 206,912 (October 5): rise of 24.39%, still open.
The confirmation delay
The June 18 low is the most extreme case. The price rose slowly from there, and the close 5% above it (177,866 points) only came on July 10, 16 sessions later. For more than three weeks, the ZigZag still showed the downward leg as if it were continuing. Anyone waiting for the indicator to recognize the low would have entered well after the turn.
The same chart with 10%
Switching the threshold to 10%, only three points remain: the low of 176,219 on March 20, the high of 198,657 on April 14, and the low of 166,335 on August 18, with the current leg open up to 206,912. The drop from April to August becomes a single leg of 16.27%, and the small rise from June to August disappears. Confirmation also takes longer: the April 14 high was only confirmed on May 13, 19 sessions later, and the August 18 low on September 2, 11 sessions later.
The last leg repaints
On October 5, the index closed at 206,912 points, 7.70% above the previous close, and the ZigZag marked a provisional high there. On October 7, the close was 204,302, only 1.26% lower. That high only becomes final if there's a close below 196,566 (5% lower); if the index closes above 206,912 before that, the high simply moves to a different spot in the drawing. That's what traders call repainting.
How to use the ZigZag
Finding highs and lows for support and resistance
The most honest use of the ZigZag is retrospective. The lows of 168,278 (June) and 166,335 (August) sat just over 1% apart, a support zone that jumps out with the filter on and stays hidden among the candles without it.
Measuring the size of the legs
Since each line connects a high to a low, comparing moves becomes easy. On the Ibovespa, the 2026 legs with a 5% filter ranged from 5.78% to 24.39%. This helps calibrate targets and stops based on what the asset tends to do, and it provides a basis for drawing Fibonacci retracements.
Choosing the threshold
Small thresholds (1% to 3%) show more detail and bring back some of the noise; large thresholds (8% to 10%) leave only the main moves. More volatile assets call for larger thresholds. A practical rule is to use something close to two to three times the asset's average daily move over the time frame you trade.
Limitations
The ZigZag doesn't predict anything: it confirms highs and lows after the price has already moved the full threshold in the opposite direction, and the last leg can change with every new candle. Because of that, it doesn't work as an entry trigger. Combine it with a momentum indicator, like the RSI, or with volume to decide when to act.
Common mistakes when using the ZigZag
- Treating the most recent high or low as if it were final, forgetting that the last leg repaints.
- Backtesting with the ZigZag without accounting for the delay: in hindsight, the indicator seems to nail every high because they've already been confirmed.
- Buying or selling the moment a leg appears, when the price has already moved 5% or 10% since the turn.
- Choosing the threshold with no relation to the asset's volatility, which creates too many or too few legs.
- Thinking the past drawing points to the next move: the examples above describe what happened with the Ibovespa, not what will happen.
To practice without risking money, open the Ibovespa chart or another asset in a demo account, apply the ZigZag at 5% and at 10%, and note, for each new leg, on what day the indicator confirmed the high or low and how far the price had already moved. This log shows, in practice, just how big the delay is.
Practice before you risk. Open your Duotide account and test your ideas on the demo account with US$10,000 in virtual funds.
Create free accountUpdated:
Editorial character of the Duotide newsroom. Articles are written by the team with the help of artificial intelligence; prices and charts come from real market data. Explains charts, indicators and trading strategies: how they work, where they fail and how to test them first.
Was this article helpful?
Be the first to rate it.
Comments
- No comments yet. Be the first to comment.
Ready to put it into practice?
Open your account and practice on the demo account with US$10,000 in virtual funds, without risking money.
- Secure platformProtected login and identity verification
- Multilingual supportHelp available every day
- Free demo accountUS$10,000 virtual to practice
Trading involves the risk of losing the capital invested.
