

 Português pt
 Español es
 العربية ar
 বাংলা bn
 Deutsch de
 Filipino fil
 Français fr
 हिन्दी hi
 Bahasa Indonesia id
 Italiano it
 Русский ru
 Svenska sv
 ไทย th
 Türkçe tr
 Tiếng Việt vi
 简体中文 zh
Updated:
IndicatorsEnvelopes Indicator: What It Is, How to Calculate and Use It
 Naomi TanakaEditorial character · Analysis Desk

Quick answer
The Envelopes indicator draws two bands at a fixed percentage distance above and below a moving average, usually the 20-period simple average. In a sideways market, touches on the bands suggest excess and a possible return to the average; in a strong trend, closes outside the band indicate strength, not a reversal.
Among channel indicators, Envelopes is the simplest to understand. It takes a moving average and draws two parallel lines, one above and one below, at a fixed percentage distance. The idea is to visualize when price has drifted too far from its average, either to spot excesses or to confirm the strength of a trend.
To show the indicator with real numbers, we use daily quotes for Alphabet (GOOGL), Google's parent company, between April and October 2026. Over the period the stock rose from $297.39 to $350.50, up 17.9%, with a high of $408.61 on May 18.
What the Envelopes indicator is
Envelopes has three lines: a moving average in the center (usually a simple one, of 20 periods), an upper band, and a lower band. The difference from Bollinger Bands is that, in Envelopes, the distance between the bands and the average is a fixed percentage you choose; in Bollinger, it changes with volatility. That makes Envelopes more predictable, but also less adaptive.

How to calculate Envelopes
- Center average: simple moving average of the last N closes (default of 20).
- Upper band: average × (1 + k), where k is the chosen percentage.
- Lower band: average × (1 − k).
Example with Alphabet on October 7, 2026
The simple average of the last 20 closes through October 7 was $344.48. With k = 5%:
- Upper band: 344.48 × 1.05 = $361.70
- Lower band: 344.48 × 0.95 = $327.26
- October 7 close: $350.50, inside the channel and 1.7% above the average
How to choose the percentage
The right percentage depends on the asset's volatility and the timeframe. A practical way is to test a few values and count how many closes land outside the channel. For Alphabet, over the period's 131 sessions:
- With 2%: 45 closes above and 33 below, almost 60% of the time outside the channel. Too narrow.
- With 3%: 34 above and 24 below.
- With 5%: 31 above and 13 below, about a third of the time outside.
- With 6%: 29 above and 7 below.
For large stocks on the daily chart, values between 2% and 5% are common; in forex, where moves are smaller, much lower percentages are used, like 0.1% to 1%. The example also shows an asymmetry: in a rising stock, price spends much more time above the upper band than below the lower one.
Real example: Envelopes on Alphabet in 2026
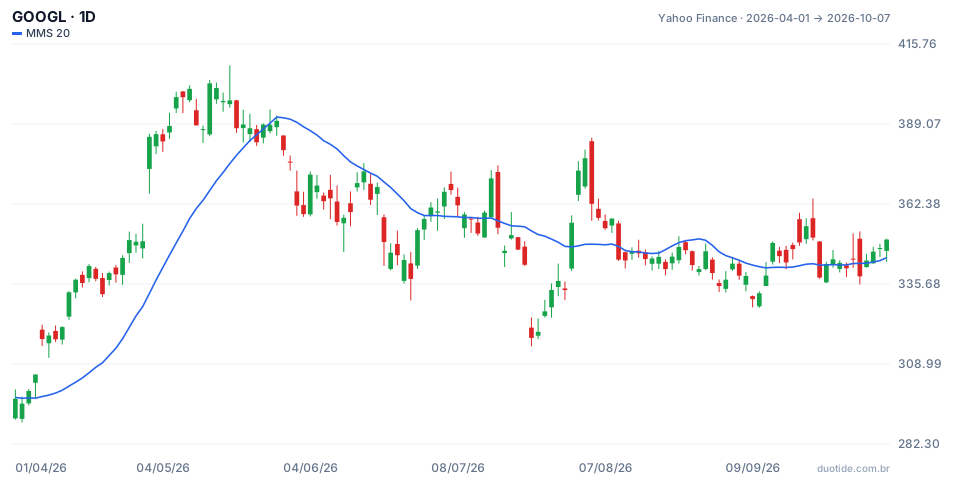
The chart shows the daily candles and the 20-period simple average, the center of the Envelopes. The 5% bands sit at that distance from the line. Three moments show the two ways to read the indicator:
April and May: price riding the band
On April 8 the stock closed at $317.32, above the upper band of $313.03 (average of 298.13). Anyone selling on "excess" would have regretted it: price stayed above the band for 29 sessions in a row, until May 18, when it closed at $396.94, up 25.1% from the first break. In a strong trend, closing outside the channel is a sign of strength, not overreach.
July: a sharp drop and a return to the average
On July 23 the stock fell 7.1% in a day, to $317.69, well below the lower band of $335.72 (average of 353.39). Ten sessions later, on August 6, it was at $357.75, up 12.6%, back above the average. Here the excess reading worked: the extreme stretch was followed by a return.
August: an upward break that didn't continue
On August 3 Alphabet closed at $373.51, above the upper band of $365.83. Ten sessions later it was at $344.00, down 7.9%. With no underlying trend sustaining the move, the band break turned into a top.

How to use Envelopes
In a sideways market: excesses
When the average is nearly flat, touches on the upper band suggest price stretched upward, and touches on the lower band, stretched downward. The return to the average is the natural target for that reading.
In a trend: strength
With the average sloped, closes outside the band in the trend's direction show strength, as in April and May. In that case, pullbacks to the center average are the points of interest for entering in the trend's favor.
Exit and stop
The center average serves as a reference for a trailing stop, and the opposite band, as a target in mean-reversion trades.
Limitations
Since the percentage is fixed, the channel doesn't adjust when volatility changes: it's too narrow during agitated phases and too wide during calm ones. The 20-period average lags, and the indicator alone can't tell whether the market is trending or sideways.
Common mistakes when using Envelopes
- Selling every time price closes above the upper band, even in a strong uptrend.
- Using the same percentage on assets with very different volatility.
- Choosing a percentage so narrow that price spends more time outside the channel than inside it.
- Forgetting to check the center average's slope before deciding how to read it.
- Treating the Alphabet examples as a rule: they describe what happened, not what will happen.
To practice, add Envelopes to an asset's daily chart on a demo account, test two or three percentages, and note, for every close outside the channel, whether the average was sloped or flat and what price did over the following ten periods. Within a few weeks you'll have a percentage tuned to the asset you trade.
Practice before you risk. Open your Duotide account and test your ideas on the demo account with US$10,000 in virtual funds.
Create free accountUpdated:
Editorial character of the Duotide newsroom. Articles are written by the team with the help of artificial intelligence; prices and charts come from real market data. Explains charts, indicators and trading strategies: how they work, where they fail and how to test them first.
Was this article helpful?
Be the first to rate it.
Comments
- No comments yet. Be the first to comment.
Ready to put it into practice?
Open your account and practice on the demo account with US$10,000 in virtual funds, without risking money.
- Secure platformProtected login and identity verification
- Multilingual supportHelp available every day
- Free demo accountUS$10,000 virtual to practice
Trading involves the risk of losing the capital invested.
