

 Português pt
 Español es
 العربية ar
 বাংলা bn
 Deutsch de
 Filipino fil
 Français fr
 हिन्दी hi
 Bahasa Indonesia id
 Italiano it
 Русский ru
 Svenska sv
 ไทย th
 Türkçe tr
 Tiếng Việt vi
 简体中文 zh
Updated:
Technical analysisHow to Use Fibonacci Retracement: Levels, Calculation, and a Real Example
 Naomi TanakaEditorial character · Analysis Desk

Quick answer
Fibonacci retracement marks, over a price move, the 23.6%, 38.2%, 50%, 61.8%, and 78.6% levels, where a correction might find support or resistance. To use it, stretch the tool from the bottom to the top of a clear rally (or from the top to the bottom of a decline) and watch how the price reacts at each level. The levels are references, not guarantees: wait for confirmation and set the stop before entering.
Among the most widely used tools in technical analysis is Fibonacci retracement, a set of horizontal lines drawn over a price move to mark regions where a correction might find support or resistance. The concept is simple, and almost every charting platform draws the levels automatically.
In this guide, instead of a made-up example, we use real daily quotes for Amazon stock (AMZN) between March and October 2026 to calculate the levels, show what the price did near each one, and make clear why this tool is a reference, not a guarantee.
What Fibonacci retracement is
The Fibonacci sequence is a progression where each number is the sum of the two before it (1, 1, 2, 3, 5, 8, 13...). From the relationships between these numbers come the ratios used on the chart: 23.6%, 38.2%, 61.8%, and 78.6%. The 50% level isn't a Fibonacci ratio, but it's usually included because many traders watch it.
The logic is: after a strong move, the price often gives back part of it before resuming the original direction or reversing for good. The levels indicate how much of the move has been given back.

How to calculate Fibonacci retracement
On a rally, the tool is stretched from the bottom to the top of the move. Each level is calculated like this:
- Level = top − (top − bottom) × ratio
On a decline, the math flips: level = bottom + (top − bottom) × ratio.
Example with real Amazon data
The stock hit a low of US$199.14 on March 27, 2026, and a high of US$287.20 on August 3, 2026. The move was 287.20 − 199.14 = US$88.06.
- 23.6%: 287.20 − 88.06 × 0.236 = 287.20 − 20.78 = US$266.42
- 38.2%: 287.20 − 88.06 × 0.382 = 287.20 − 33.64 = US$253.56
- 50%: 287.20 − 44.03 = US$243.17
- 61.8%: 287.20 − 88.06 × 0.618 = 287.20 − 54.42 = US$232.78
- 78.6%: 287.20 − 88.06 × 0.786 = 287.20 − 69.22 = US$217.98
Real example: Amazon's correction in 2026
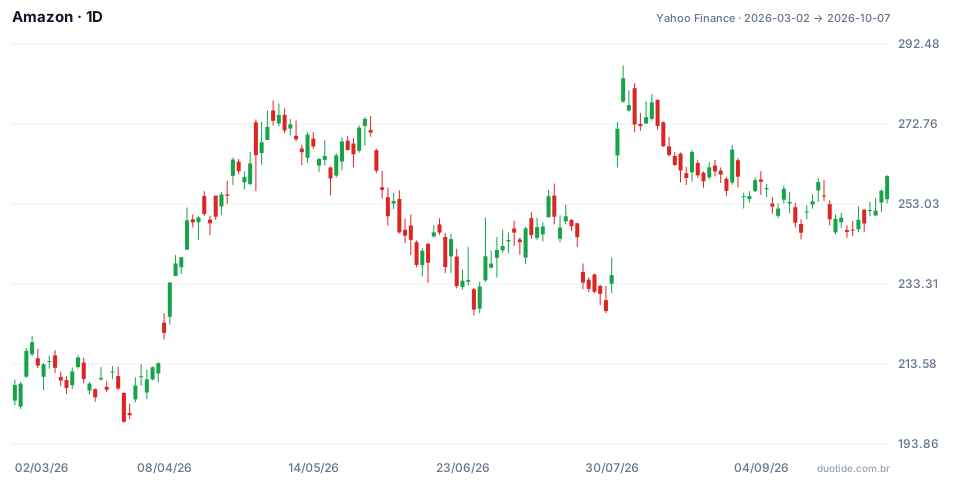
The chart shows Amazon from March to October 2026. The August 3 high came right after a jump: the stock closed July 30 at US$235.50 and July 31 at US$271.58. The correction began from there, and each level played a different role:
August: the 23.6% level didn't hold
On August 13 the stock closed at US$265.13, below the US$266.42 of the first level. Over the next two weeks it swung between that level and the 38.2% one, with a low of US$255.02 on August 27.
September: a pause at 38.2% and a drop near 50%
On September 1 the low was US$251.93 and the close US$254.92, practically right on the 38.2% level. The stock bounced to US$258.90 on September 3, but closed September 9 at US$252.40, below the level. The decline stopped on September 16, with a low of US$244.30, US$1.13 above the 50% level. The correction gave back 48.7% of the rally.
After the bottom: a bounce and a retest
On September 21 the stock closed at US$258.45. It retested the region on September 28, with a low of US$244.73, and closed October 7 at US$259.92. The 50% level matched the bottom, but you only know that in hindsight; on September 16 there was no way to know the decline would stop there and not at US$232.78, the next level down. These are past facts, not a forecast.

How to use Fibonacci retracement
Pick clear points
Use the move's most obvious bottom and top, ones that are easy to spot on the daily chart. The choice changes everything: if someone used the July 29 low (US$226.16) as the bottom instead of March's, the 61.8% level would land at US$249.48, and September's low would have blown right through it. The same correction could look like it respected a level in one setup and broke it in another.
Look for confluence
Levels that line up with earlier supports and resistances carry more weight. In the example, the 61.8% level (US$232.78) sat close to the June 22 close of US$232.79, a region where the stock had already stopped before.
Wait for confirmation
Instead of buying when the price touches the line, watch for a reversal candle, a rise in volume on the bounce, or the price climbing back above the previous level. On September 17, one day after the bottom, Amazon closed at US$251.19, above the low and closer to the 38.2% level.
Set the stop beforehand
A common practice is placing the stop a bit past the next level. Anyone buying near the 50% level would use something below the 61.8% level, knowing in advance exactly how much they're risking.
Limitations
Fibonacci retracement doesn't predict the future. With five levels close together, the price almost always stops near one of them, which makes the tool look more precise than it is. In many cases the price blows through every level without any meaningful pause.
Common mistakes when using Fibonacci retracement
- Buying or selling just because the price reached a line, without confirmation.
- Tweaking the bottom and top until the levels match what already happened.
- Using small moves, where the levels end up bunched right on top of each other.
- Ignoring the main trend and treating every level as a reversal point.
- Trading without a stop because the level is supposed to hold.
To practice without risking money, draw Fibonacci retracement on past moves of the asset you follow on a demo account and note where each correction stopped. After a few dozen cases, you'll have a real sense of how much the levels help with that asset.
Practice before you risk. Open your Duotide account and test your ideas on the demo account with US$10,000 in virtual funds.
Create free accountUpdated:
Editorial character of the Duotide newsroom. Articles are written by the team with the help of artificial intelligence; prices and charts come from real market data. Explains charts, indicators and trading strategies: how they work, where they fail and how to test them first.
Was this article helpful?
Be the first to rate it.
Comments
- No comments yet. Be the first to comment.
Ready to put it into practice?
Open your account and practice on the demo account with US$10,000 in virtual funds, without risking money.
- Secure platformProtected login and identity verification
- Multilingual supportHelp available every day
- Free demo accountUS$10,000 virtual to practice
Trading involves the risk of losing the capital invested.
