

 Português pt
 Español es
 العربية ar
 বাংলা bn
 Deutsch de
 Filipino fil
 Français fr
 हिन्दी hi
 Bahasa Indonesia id
 Italiano it
 Русский ru
 Svenska sv
 ไทย th
 Türkçe tr
 Tiếng Việt vi
 简体中文 zh
Updated:
IndicatorsParabolic SAR: What It Is, How to Calculate It, and How to Use It
 Naomi TanakaEditorial character · Analysis Desk

Quick answer
The Parabolic SAR is a trend indicator created by J. Welles Wilder that draws dots below the price in an uptrend and above it in a downtrend. The dots move closer to the price with every candle, accelerating whenever new highs or lows appear, and the flip happens when the price touches the dot. It works well as a trailing stop in clear trends and generates many false signals in sideways markets.
The Parabolic SAR was introduced by J. Welles Wilder in 1978, in the same book where he launched the RSI and the ATR. SAR stands for stop and reverse: the original idea was that the trader would always be positioned, long or short, and that the indicator's dot would act at the same time as the stop for the current position and the entry for the opposite one.
In this guide we use real daily Tesla (TSLA, Yahoo Finance data) quotes between April and October 2026, with the standard 0.02 and 0.20 setting, to show the calculation and what would have happened following every flip of the indicator.
What the Parabolic SAR Is
On the chart, the SAR shows up as a sequence of dots:
- Dots below the candles: an uptrend. The dot rises every day and serves as a stop for anyone long.
- Dots above the candles: a downtrend. The dot falls every day and serves as a stop for anyone short.
- Flip: when the day's low pierces the dot in an uptrend (or the high pierces the dot in a downtrend), the indicator switches sides.
The name parabolic comes from the shape of the curve: at the start of a trend the dots move slowly and, as the price makes new extremes, they accelerate toward it.

How to Calculate the Parabolic SAR
The formula uses three elements:
- EP (extreme point): the highest high of the current uptrend, or the lowest low of the downtrend.
- AF (acceleration factor): starts at 0.02 and increases by 0.02 with every new EP, up to a cap of 0.20.
- Tomorrow's SAR = today's SAR + AF × (EP − today's SAR).
Two rules complete the calculation. In an uptrend, the SAR can never sit above the lows of the last two candles; in a downtrend, never below the highs of the last two. And, on the flip, the new SAR becomes the EP of the trend that just ended, with the AF resetting to 0.02.
Example with Real Tesla Data
In August 2026, Tesla was in an uptrend by the SAR. At the end of August 12:
- SAR = $304.03; EP (the uptrend's highest high) = $336.20; AF = 0.06
- August 13 SAR = 304.03 + 0.06 × (336.20 − 304.03) = 304.03 + 1.93 = $305.96
- On August 13 the high was $341.64, a new extreme: EP becomes 341.64 and AF rises to 0.08
- August 14 SAR = 305.96 + 0.08 × (341.64 − 305.96) = 305.96 + 2.85 = $308.81
With the higher AF, the dot rose $2.85 instead of $1.93. That's how the stop tightens as the trend progresses. Values can differ by a few cents between platforms, because of the point where each one starts the calculation.
Real Example: Tesla's Parabolic SAR in 2026
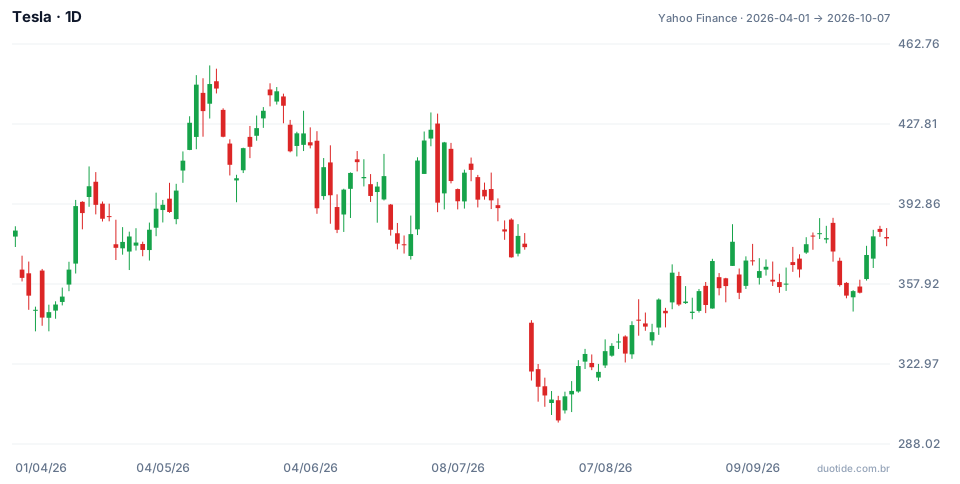
In the chart, Tesla starts April at $381.26 and ends on October 7, 2026 at $377.81, practically in the same spot, but passing through a high of $453.40 on May 13 and a low of $297.38 on July 29. Over this 131-trading-day span, the SAR flipped 11 times. To keep things simple, the results below use the closing price on the day of each flip.
July: The Decline Well Captured
On July 15 the low of $390.66 pierced the SAR and the indicator flipped down, with the stock closing at $394.46. On July 23 Tesla opened with a gap down and closed at $319.69, against $374.01 the day before. The AF kept rising to 0.18 and the SAR descended behind the price until the bullish flip on August 4, with a close of $327.35. A sale following the SAR would have gained $67.11 per share, 17.0% of the entry price.
August and September: The Rally and the Trailing Stop
From the August 4 flip through September 14, the dots stayed below the price and kept rising: $297.38 on August 4, $327.38 on August 21, $357.68 on September 11. On September 14 the low of $357.04 touched the dot and ended the rally with a close of $358.97. The August 4 buy would have returned $31.62 per share, 9.7%, without the trader having to decide where to move the stop.
Late September: Three Flips in Three Weeks
After September 14 the stock moved sideways, and the SAR flipped on September 22 (close of $378.90), on September 28 ($357.45), and on October 5 ($378.73). Following each flip, there were three losses in a row, of $19.93, $21.45, and $21.28 per share. Adding up all ten trades closed between April 15 and October 5, the result would have been a loss of $63.84 per share, with only 3 winning trades, before costs. The two big gains from July and August didn't cover the losses from the trendless phases.

How to Use the Parabolic SAR
As a Trailing Stop
This is its most useful application. Anyone already in a position for another reason can use the SAR's dot as a stop and adjust it with every candle. The indicator solves a common question, where to move the stop, with an objective rule.
With a Trend Filter
Since the SAR alone is always positioned, it loses during sideways phases. A filter such as the ADX above 25, or the price above the 200-period average, helps you trade only the flips in favor of the bigger trend and ignore the rest.
Adjusting the Acceleration Factor
A smaller starting AF, such as 0.01, keeps the dots farther from the price and reduces the flips, at the cost of giving back more profit on the exit. A larger AF does the opposite. Changing the setting completely changes the results, so test it first on the asset you trade.
Limitations
The SAR doesn't measure the trend's strength, it just follows it. In sideways markets it flips all the time, as May, June, and September showed in Tesla. Price gaps at the open, like the one on July 23, can make the price blow far past the dot, and the stop ends up worse than planned.
Common Mistakes When Using the Parabolic SAR
- Flipping the position on every reversal, without a trend filter.
- Using the SAR on assets or periods without a clear trend.
- Changing the acceleration factor without testing the effect on the number of signals.
- Assuming the SAR's dot guarantees the exit at that price: on opening gaps, the execution can be much worse.
- Judging the indicator by its best stretches, like July, and forgetting the losing streaks.
- Forgetting that the examples above describe what happened, not what will happen.
To practice, place the Parabolic SAR on the daily chart of an asset you follow in your demo account and log, over a few weeks, every flip, the entry and exit price, and the result. Then repeat the log using the SAR only as a stop for trades chosen by another criterion and compare the two results.
Practice before you risk. Open your Duotide account and test your ideas on the demo account with US$10,000 in virtual funds.
Create free accountUpdated:
Editorial character of the Duotide newsroom. Articles are written by the team with the help of artificial intelligence; prices and charts come from real market data. Explains charts, indicators and trading strategies: how they work, where they fail and how to test them first.
Was this article helpful?
Be the first to rate it.
Comments
- No comments yet. Be the first to comment.
Ready to put it into practice?
Open your account and practice on the demo account with US$10,000 in virtual funds, without risking money.
- Secure platformProtected login and identity verification
- Multilingual supportHelp available every day
- Free demo accountUS$10,000 virtual to practice
Trading involves the risk of losing the capital invested.
