

 Português pt
 Español es
 العربية ar
 বাংলা bn
 Deutsch de
 Filipino fil
 Français fr
 हिन्दी hi
 Bahasa Indonesia id
 Italiano it
 Русский ru
 Svenska sv
 ไทย th
 Türkçe tr
 Tiếng Việt vi
 简体中文 zh
Updated:
IndicatorsRVI (Relative Vigor Index): What It Is, How to Calculate and Use It
 Naomi TanakaEditorial character · Analysis Desk

Quick answer
The RVI (Relative Vigor Index) is an oscillator that compares each candle's close with its open, divided by the candle's range, and smooths the result over 10 periods. Positive values mean candles have been closing above the open (buying vigor), and negative values the opposite. The most used signals are the RVI crossing its signal line and divergences between the indicator and price.
The indicator known as the RVI, or Relative Vigor Index, was published by John Ehlers in the early 2000s. It builds on an old observation among traders: in healthy uptrends, candles tend to close above the open and near the high; in downtrends, below the open and near the low. When that stops happening, the move may be losing steam even if the price is still advancing.
In this guide we use real daily prices for Microsoft stock (Yahoo Finance data) from April to October 2026 to show the calculation and what the indicator actually signaled. The RVI isn't drawn on the chart below; we calculated the lines from the same candles and point out the dates in the text.
What the RVI is
The RVI is a momentum oscillator that compares where the candle closed relative to where it opened, divided by the candle's total range. The result oscillates around zero: positive values show closes above the opens (buying vigor), negative values show the opposite. The indicator comes with two lines, the RVI itself and a signal line, which is a weighted average of it.

How to calculate the RVI
- A candle's ratio: (close − open) ÷ (high − low). Ranges from −1 to +1.
- Smoothing: the numerator and denominator are weighted over the last four candles (weights 1, 2, 2, 1) and summed over 10 periods before dividing.
- Signal line: (RVI + 2 × yesterday's RVI + 2 × the RVI from two days ago + the RVI from three days ago) ÷ 6.
Example with real Microsoft data
On September 3, 2026, the stock opened at $501.66, made a high of $515.65, a low of $500.80, and closed at $510.12. The candle's ratio was (510.12 − 501.66) ÷ (515.65 − 500.80) = 8.46 ÷ 14.85 = 0.57: the close landed much closer to the high than to the low.
Adding up the 10 sessions from August 21 to September 3, the close-minus-open differences total $46.47 and the ranges total $100.42. In the simple version, 46.47 ÷ 100.42 = 0.463. With the 1-2-2-1 weighting used by platforms, that day's RVI came out to 0.436, the highest value of the entire period analyzed.
Real example: the RVI on Microsoft in 2026
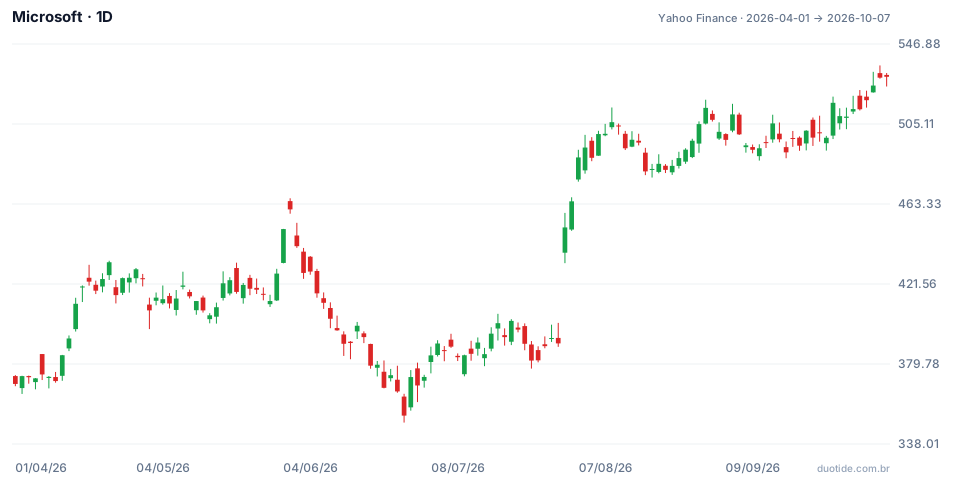
The stock went from $369.37 on April 1 to $529.76 on October 7, up 43.42%, with a low of $349.20 on June 25 and a high of $535.69 on October 6. Over those 131 sessions, the RVI crossed its signal line 19 times. Four moments show what the indicator does well and where it fails.
April: a bullish crossover at the bottom
On April 1, the RVI stood at −0.497, the period's lowest value, and crossed above the signal line with the stock at $369.37. Ten sessions later the price was at $420.26, up 13.8%. A bullish crossover coming from a deeply negative value is the indicator's strongest reading.
Late May: a false signal followed by a correct one
On May 28, the RVI crossed up, with the stock at $426.99. Ten sessions later it was 8.6% cheaper. On June 3, with the price at almost the same spot ($427.34), came the bearish crossover, and ten sessions later the drop was 11.3%, to $378.91. In just a few days the indicator gave two opposite signals; only the second one tracked the move.
July: the gap the RVI doesn't see
On July 23, the RVI crossed down with the stock at $381.58. On July 30, the stock opened at $437.90, 12.1% above the previous close ($390.54), and closed at $451.10. Ten sessions after the bearish signal, the price was 31% higher. The technical detail explains the failure: the July 30 candle rose $60.56 over the previous day, but closed only $13.20 above its own open. Since the RVI compares the close with the open of the same candle, almost all of the jump fell outside the calculation.
September and October: divergence
On October 7, the stock closed at $529.76, 3.9% above the September 3 close, but the RVI stood at 0.127, well below the peak of 0.436. A higher price with a lower RVI is bearish divergence: the recent candles closed with less vigor. By the end of the window, that hadn't translated into a drop.

How to use the RVI
The crossover with the signal line
The RVI crossing above the signal line suggests buying vigor is building; crossing below suggests selling vigor. Crossovers carry more weight when they happen far from zero, as on April 1, and less when the two lines are hugging each other near zero, where they cross back and forth constantly.
Divergences
Price at a higher high with the RVI at a lower high (bearish divergence), or price at a lower low with the RVI rising (bullish divergence), point to a change in the move's vigor. They call for confirmation from the price itself, such as a break of support, before any decision.
Combining it with the trend
A common way to reduce false signals is to use the RVI only in the direction of the larger trend: with the price above a long moving average, consider only bullish crossovers. On Microsoft, with the overall trend up, five of the period's nine bearish crossovers were followed by a higher price ten sessions later, including the July one.
Limitations
The RVI ignores opening gaps, as July showed, and lags because of the smoothing. On assets whose opening price almost always repeats the previous close, such as some currency pairs, the ratio loses meaning. And, like every oscillator, it generates a lot of crossovers in a sideways market.
Common mistakes when using the RVI
- Trading every crossover with the signal line: there were 19 in just over six months on Microsoft.
- Forgetting that the indicator can't see gaps between one candle and the next.
- Going against the main trend just because the RVI turned down.
- Treating divergence as an immediate reversal signal.
- Thinking the past guarantees the future: the examples above describe what happened with Microsoft, not what will happen.
To practice without risking money, add the RVI to the daily chart of a stock you follow in a demo account and note, over a few weeks, every crossover with the signal line, the distance from zero on that day, and what the price did afterward. This log quickly shows which crossovers deserve attention.
Practice before you risk. Open your Duotide account and test your ideas on the demo account with US$10,000 in virtual funds.
Create free accountUpdated:
Editorial character of the Duotide newsroom. Articles are written by the team with the help of artificial intelligence; prices and charts come from real market data. Explains charts, indicators and trading strategies: how they work, where they fail and how to test them first.
Was this article helpful?
Be the first to rate it.
Comments
- No comments yet. Be the first to comment.
Ready to put it into practice?
Open your account and practice on the demo account with US$10,000 in virtual funds, without risking money.
- Secure platformProtected login and identity verification
- Multilingual supportHelp available every day
- Free demo accountUS$10,000 virtual to practice
Trading involves the risk of losing the capital invested.
