

 Português pt
 Español es
 العربية ar
 বাংলা bn
 Deutsch de
 Filipino fil
 Français fr
 हिन्दी hi
 Bahasa Indonesia id
 Italiano it
 Русский ru
 Svenska sv
 ไทย th
 Türkçe tr
 Tiếng Việt vi
 简体中文 zh
Updated:
Risk managementTake Profit and Stop Loss: How to Calculate Them
 Camila NascimentoEditorial character · Risk & Behavior Desk

Quick answer
Stop loss is the price where you accept exiting at a loss; take profit is the price where you lock in the planned gain, both set before entry. A practical way to calculate them is to place the stop at about 2 times the entry's ATR (or beyond a support) and the target at a multiple of the risk or just before the next resistance. With a target at twice the risk, you only need to win more than 33% of trades to avoid losing money, before costs.
Take profit and stop loss are two prices set before opening a trade: one marks where the planned profit will be locked in, the other marks how far the loss is acceptable. It sounds simple, but it's how those levels are calculated, not just the fact that they exist, that separates solid risk management from a bet.
In this guide we use Apple's (AAPL) real daily quotes between April and October 2026 to calculate the stop and the target with the ATR and show what each choice would have led to.
What stop loss and take profit are
The stop loss automatically closes the trade when the price reaches a predefined loss level. The take profit closes the trade when the price reaches the planned profit. Together, they define the risk-reward ratio before entry, while your head is still clear.
Three ways to place the stop
- Chart structure: a bit beyond a recent support or resistance.
- Volatility: a multiple of the ATR, the asset's average daily range, so it doesn't sit inside the normal noise.
- Fixed percentage: more common over long horizons, but it ignores each asset's volatility.
Three ways to place the target
- A multiple of the risk: two or three times the distance between the entry and the stop.
- Structure: a bit before the next resistance (on longs) or support (on shorts).
- A moving exit: a trailing stop that follows the price instead of a fixed target.

How to calculate stop loss and take profit with the ATR
On August 28, 2026, Apple closed at $319.70, with a 14-day ATR of $7.15.
- Stop at 2 ATR: 319.70 − 2 × 7.15 = $305.40, a risk of $14.30 per share (4.47%).
- Target at twice the risk: 319.70 + 2 × 14.30 = $348.30.
- Target by structure: the previous high was $344.57, on July 29; a target just below it, at $343.00, would give a gain of $23.30 (7.29%), or 1.63 times the risk.
- Position size to risk $100: 100 ÷ 14.30 = 6.99, or 7 shares.
Real example: what each choice would have given on Apple
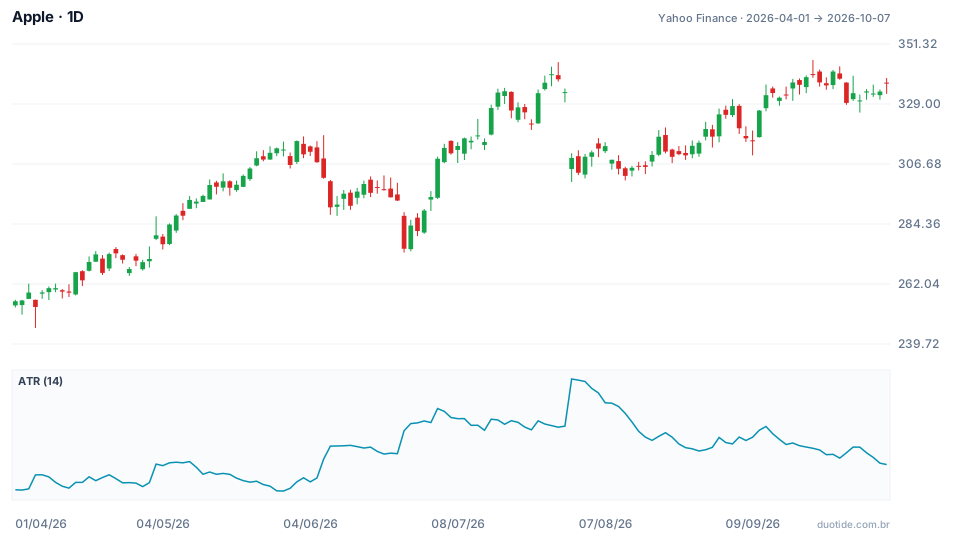
The chart shows Apple's 14-day ATR. It ranged from $5.57 on May 29 to $9.87 on July 31 and stood at $6.58 on October 7. Three situations show how the stop and the target change the outcome of the same entry.
A 1 ATR stop: stopped out before the rally
With a stop of just 1 ATR, at $312.55, the trade would have been closed on September 9, when the low reached $309.90. After that the stock climbed to $345.34 on September 22. A stop too tight relative to volatility usually gets hit by noise, not by the idea being wrong.
A 2R target versus a structure-based target
With the 2 ATR stop, the September 9 low stayed above the stop, and the trade kept running. The structure-based target, at $343.00, was reached on September 22, when the high was $345.34. The 2R target, at $348.30, was never reached through October 7: on September 29 the stock closed at $329.40, 4.62% below the September 22 high. Anyone who insisted on the fixed multiple gave back a good part of the gain; anyone who respected the previous resistance locked in 1.63R.
June's gap: the stop doesn't guarantee the price
On June 24, Apple closed at $293.08. On June 25 it opened at $287.40, 1.94% lower, and closed at $275.15, down 6.12% on the day. A stop at $290.00 would have been filled at the open, near $287.40, not at the order's price. These examples describe what happened, not what will happen.

The risk-reward ratio in practice
The risk-reward ratio sets the minimum win rate needed to avoid losing money: minimum rate = 1 ÷ (1 + R). With a 1R target, it's 50%; with 2R, 33%; with 3R, 25%.
In ten trades with a $3.00 risk and a $6.00 target (2R), four wins and six losses result in a gain of $24.00 against a loss of $18.00: a net $6.00 with only a 40% win rate. With a 1R target, the same sequence would produce a $6.00 loss. Costs and spread factor into this math and raise the minimum rate.
How to use take profit and stop loss
Stop at breakeven
When the trade moves a distance equal to the risk, moving the stop to the entry price removes the chance of a gain turning into a loss. The trade-off is getting stopped out by a normal pullback; that's why many traders wait for an advance of 1R or more.
A partial exit
Taking half the position off at the structure-based target and leaving the rest with a trailing stop combines the two approaches from the Apple example.
Limitations
No calculation guarantees the target will be reached or that the stop will be filled at the exact price. The ATR is calculated from the past and changes over time, so revisit the levels when volatility shifts a lot.
Common mistakes when setting take profit and stop loss
- Moving the stop farther away when the price gets close to it, turning a small loss into a big one.
- Placing the target so close to the entry that gains don't pay for the losses.
- Using a stop of 1 ATR or less and getting stopped out by the asset's normal noise.
- Fixing a risk multiple without checking whether there's a resistance in the way.
- Ignoring spread, fees, and gaps when calculating the real risk.
To practice without risking money, use a demo account to record, before each trade, the stop, the target, the day's ATR, and the risk-reward ratio. After a few weeks, compare the results of multiple-based and structure-based targets in your journal: the numbers will show which combination works for the asset you trade.
Practice before you risk. Open your Duotide account and test your ideas on the demo account with US$10,000 in virtual funds.
Create free accountUpdated:
Editorial character of the Duotide newsroom. Articles are written by the team with the help of artificial intelligence; prices and charts come from real market data. Writes about risk management, position sizing and the psychology behind traders' decisions.
Was this article helpful?
Be the first to rate it.
Comments
- No comments yet. Be the first to comment.
Ready to put it into practice?
Open your account and practice on the demo account with US$10,000 in virtual funds, without risking money.
- Secure platformProtected login and identity verification
- Multilingual supportHelp available every day
- Free demo accountUS$10,000 virtual to practice
Trading involves the risk of losing the capital invested.
