

 Português pt
 Español es
 العربية ar
 বাংলা bn
 Deutsch de
 Filipino fil
 Français fr
 हिन्दी hi
 Bahasa Indonesia id
 Italiano it
 Русский ru
 Svenska sv
 ไทย th
 Türkçe tr
 Tiếng Việt vi
 简体中文 zh
Updated:
CommoditiesWhat Moves Commodity Prices: Oil, Gold, and Grains
 Rafael AzevedoEditorial character · Markets Desk
Quick answer
Commodity prices are driven mainly by physical supply and demand, and by whatever affects the two: inventories, weather and harvests, decisions by producing countries, conflicts, the dollar's value, and interest rates. Since production is slow to react, supply shocks produce big, fast moves: in March 2026, WTI crude rose 35.6% in a week.
Oil, gold, corn, and coffee have something in common: they're physical raw materials, produced, transported, stored, and consumed in real quantities. That's why their prices react to very different factors than the ones that move a tech stock, and with an intensity that tends to surprise people coming from the stock market.
This article explains the main price drivers for each group of commodities and shows, with real futures contract quotes between February and October 2026, the size of the moves these factors produce.
What Commodities Are and How They're Grouped
Commodities are standardized products, where one unit is practically the same as another, regardless of who produced it. Most of the trading happens in futures contracts, on exchanges like the CME in the United States and the B3 in Brazil. They're usually split into three groups:
- Energy: oil, natural gas, and refined products. Sensitive to production decisions, inventories, and conflicts in producing regions.
- Metals: gold and silver react to interest rates, the dollar, and the search for safety; copper and aluminum, to industrial activity.
- Agricultural: corn, soybeans, coffee, wheat, and sugar. Highly sensitive to weather and the harvest calendar.

The Factors That Move Prices
Supply and Demand
This is the foundation of everything. When supply grows faster than consumption, the price tends to fall; when supply is disrupted or consumption speeds up, it tends to rise. The particular thing about commodities is that supply is slow to react: opening an oil well or planting a new crop takes months or years. That's why supply shocks produce big price jumps in the short term.
Inventories
Inventories work as a buffer. With high inventories, a supply disruption weighs less; with low inventories, any piece of news moves the price a lot. Weekly US oil inventory reports and monthly agricultural supply and demand reports from the US Department of Agriculture tend to move prices on the day they're released.
Weather and the Harvest Calendar
For grains and coffee, rainfall and temperature in producing regions during planting and crop development determine the harvest's size. A drought at the wrong moment can change production expectations within a few weeks.
The Dollar and Interest Rates
Most commodities are priced in dollars. When the dollar strengthens, they become more expensive for buyers in other countries, which tends to weigh on prices. High interest rates raise the cost of holding inventories and of carrying assets that pay no yield, like gold.
Geopolitics and Production Decisions
Conflicts, sanctions, and agreements between producing countries, like OPEC+ decisions on oil quotas, change expected supply all at once and tend to trigger the sharpest moves.
Real Example: Oil in 2026
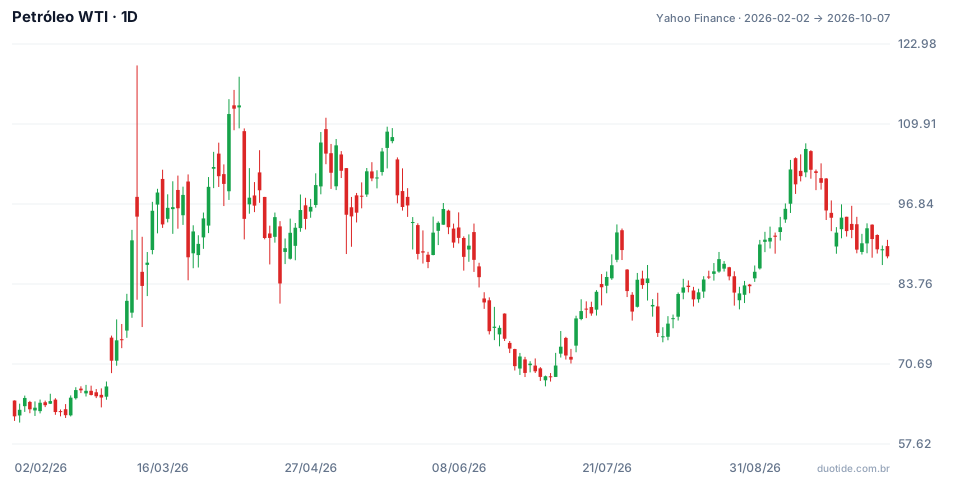
The chart shows the WTI crude futures contract, in dollars per barrel, from 02/02/2026 to 10/07/2026. Over the period, the price went from $62.14 to $88.28, up 42.1%. The chart shows the size and speed of the moves; to know the cause of each one, you need to cross-check the dates with the news from that time.
March: a Price Shock
On 02/27 the barrel closed at $67.02. On 03/06, five sessions later, it closed at $90.90, up 35.6% in a week. On 03/09 the intraday high reached $119.48 and that same day's low was $81.19, a range of $38.29 in a single session, equal to 42% of the previous close. It's the picture of a market where expected supply suddenly changed.
April to July: the Giveback
On 04/08 the price fell 16.4% in a day, from $112.95 to $94.41. Between 04/01 ($100.12) and 07/01 ($68.58), the barrel lost 31.5%. It then climbed back and closed 10/07 at $88.28. With an annualized volatility of 61.6% between April and October, oil swung five times more than the S&P 500 (12.2%) over the same period.
Other Commodities Over the Same Period
Different commodities moved in different directions, which shows there's no single driver. Between 03/02 and 10/07/2026, while oil was rising, gold fell from $5,311.60 to $4,140.70 per ounce (−22.0%) and silver, from $88.28 to $59.90 (−32.1%). Corn, priced in cents per bushel, rose from 421.00 on 07/01 to 521.50 on 09/01, up 23.9% in two months, a period that coincides with the development of the US harvest.

How to Use These Factors in Your Analysis
Know Each Commodity's Calendar
Oil has weekly inventory reports and periodic OPEC+ meetings. Grains have monthly crop reports and critical weather windows. Knowing when these events happen helps avoid being caught off guard by a price jump.
Watch the Dollar
A strong dollar move tends to show up, in the opposite direction, across several commodities at the same time. Comparing a commodity's chart with the dollar index helps separate what's specific to the product from what's a currency effect.
Adjust Risk to Volatility
With 10% or 15% swings in a single day, like oil's in March and April, the stop and the position size need to be calculated with plenty of room. What's a wide stop on a stock can be noise on a commodity.
Limitations
Fundamental factors explain the long-term direction, but they rarely say when the price will move. The market has often already priced in the news before it's confirmed. And futures contracts have expiration dates: one contract's price can differ from another's, and rolling them over has a cost.
Common Mistakes When Analyzing Commodities
- Treating all commodities as a single block: in 2026, oil and gold moved in opposite directions.
- Reacting to the headline without checking whether the price had already moved before the news.
- Using the same position size as stocks on an asset that swings five times more.
- Ignoring the dollar and interest rates when analyzing gold and other metals.
- Forgetting that futures contracts expire and that a continuous quote mixes different contracts.
- Reading the moves above as a forecast: they describe what happened, not what will happen.
To practice, open a commodity's chart in a demo account, note the dates of the reports that affect it, and log what the price did in the following days. After a few months, this journal will show which events actually move the asset you follow.
Practice before you risk. Open your Duotide account and test your ideas on the demo account with US$10,000 in virtual funds.
Create free accountUpdated:
Editorial character of the Duotide newsroom. Articles are written by the team with the help of artificial intelligence; prices and charts come from real market data. Follows the news that moves prices — rates, stock markets, companies and commodities — explained without jargon.
Was this article helpful?
Be the first to rate it.
Comments
- No comments yet. Be the first to comment.
Ready to put it into practice?
Open your account and practice on the demo account with US$10,000 in virtual funds, without risking money.
- Secure platformProtected login and identity verification
- Multilingual supportHelp available every day
- Free demo accountUS$10,000 virtual to practice
Trading involves the risk of losing the capital invested.
