

 Português pt
 Español es
 العربية ar
 বাংলা bn
 Deutsch de
 Filipino fil
 Français fr
 हिन्दी hi
 Bahasa Indonesia id
 Italiano it
 Русский ru
 Svenska sv
 ไทย th
 Türkçe tr
 Tiếng Việt vi
 简体中文 zh
Updated:
Technical analysisHighest High and Lowest Low: How to Use the N-Period High and Low
 Naomi TanakaEditorial character · Analysis Desk

Quick answer
The highest high is the highest price over the last N periods, and the lowest low is the lowest price over the same stretch. Together, they form a channel showing the recent trading range: a close above the N-period high signals a bullish breakout, and a close below the low signals a bearish one. They're the foundation of classic trend-following systems, but they generate false signals in a sideways market.
Among the simplest indicators, and precisely because of that, widely used ones are the highest high and the lowest low over a fixed number of periods. Despite their simplicity, they're the foundation of breakout systems used for decades in stocks, currencies, rates, and commodities.
In this guide we use real daily prices for the S&P 500 index (Yahoo Finance data) from April to October 2026 to show the calculation, how the channel behaved, and the result of a simple breakout system over that period.
What highest high and lowest low are
The 20-period highest high is the largest high price over the last 20 candles. The 20-period lowest low is the smallest low price over the same stretch. With every new candle, the oldest one drops out of the window and the new one enters.
Unlike a moving average, which smooths out the price, these two lines mark extremes the market actually traded. On the chart, they look like steps: they stay flat while the price oscillates inside the range, step up when a new high appears, and step down when a new low appears. Together, they form what's known as the Donchian Channel, named after Richard Donchian, one of the pioneers of trend-following systems.

How to calculate the N-period high and low
To check whether today's candle broke the range, compare today's close with the high and low of the previous N candles (not including today's, or the breakout would never happen).
Example with the S&P 500 on October 6, 2026
- Highest high of the previous 20 sessions: 7,794.35 points, set on October 5.
- Lowest low of the same 20 sessions: 7,507.77 points, set on September 16.
- Channel width: 7,794.35 − 7,507.77 = 286.58 points, or 3.8% over the low.
- October 6 close: 7,818.93 points, above the 20-session high. By the closing criterion, that's a bullish breakout.
On October 7, the index closed at 7,801.77, still above the old ceiling of 7,794.35, which became the first support reference.
Real example: the 20-day channel on the S&P 500 in 2026
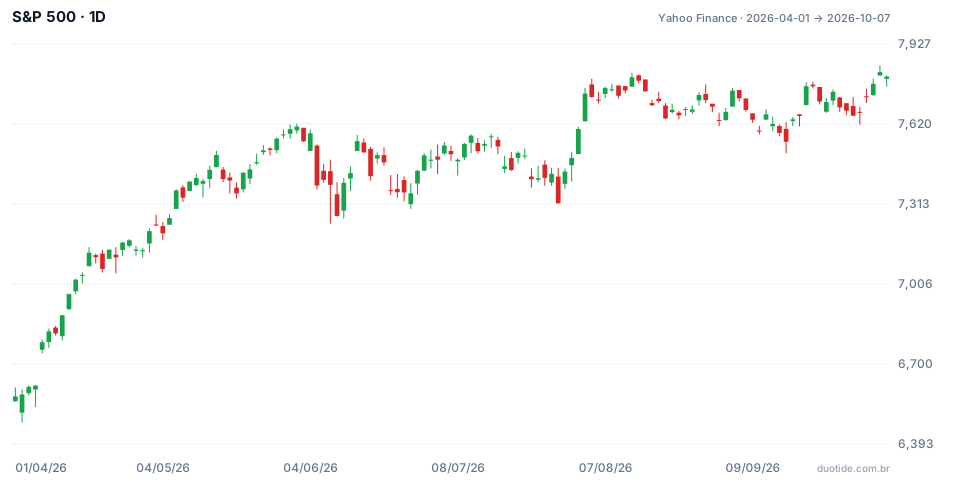
To test the idea objectively, we applied a simplified version of the rule made famous by the Turtle Traders in the 1980s: buy on a close above the previous 20 sessions' high, and exit on a close below the previous 10 sessions' low. No costs, no leverage, just to see the behavior.
April to June: the breakout that caught the trend
On April 9, the S&P 500 closed at 6,824.66, above the 20-session high (6,811.15). The uptrend continued, and the best close came on June 2, at 7,609.78, 11.5% above the entry. On June 5, the index fell from 7,584.31 to 7,383.74, below the 10-session low (7,389.48), and the rule signaled an exit. Result: +8.2%. The exit gave back part of the gain, the price paid for waiting for confirmation.
July: a failed bearish breakout
On July 29, the index closed at 7,316.15, below the previous 20-session low (7,376). The next day it was already closing at 7,437.63, and on August 3 it broke above the 20-session high (7,581.50), closing at 7,600.50. Anyone who sold on the bearish breakout saw the price move back inside the range the very next day and break out the opposite side three sessions later.
August: a short bullish breakout
The August 3 buy at 7,600.50 reached 7,798.99 on August 13 (+2.6%), but on August 20 the close of 7,641.16 fell below the 10-session low (7,688.63). Result: +0.5%. In September the index closed below the 20-session low again on September 10 and September 16 with no follow-through, and on October 6 came the bullish breakout cited above, which remains open at the final date of the data.
These are two closed results in a period of strong gains for the index. They describe what happened, not what will happen, and a sample this small isn't enough to evaluate a system.

How to use the N-period high and low
As a breakout trigger
A close above the N-period high shows the price has reached a level it hadn't touched in N candles. It's the buy trigger for trend-following systems; the mirror image, below the low, is the sell trigger.
As a trailing stop
The low of a shorter period (10 sessions, in the test above) works as a stop that only moves up on a long position. It gives room for normal swings and closes the trade when the market makes a low below the recent range.
As a measure of sideways movement
A narrow channel relative to the asset's history indicates consolidation; a widening channel indicates volatility and trend. In the October 6 example, the 20-day channel's 3.8% width helps size the stop and the position.
Choosing the period
Short periods, like 10, generate breakouts more often and more false signals. Long periods, like 55, generate rarer signals and react more slowly. Test the period on the asset and the time frame you trade before settling on a number.
Limitations
Range breakouts work in a trend and struggle in a sideways market, as shown by the July and September closes below the low that didn't follow through. The system buys near highs and exits after the price has already pulled back, so it wins on long trends and racks up small losses on false ones. Gaps can push the exit well below the line.
Common mistakes when using the highest high and lowest low
- Including the current candle in the high calculation, which prevents the breakout from ever appearing.
- Entering on an intraday touch of the line instead of waiting for the close.
- Trading every breakout in a sideways market, where false signals pile up.
- Placing the stop on the opposite line of a wide channel, with too much risk for the position size.
- Judging the system by a handful of trades, like the two in the example.
- Comparing breakouts from different time frames as if they carried the same weight.
To practice without risking money, mark the 20-period high and low of the asset you follow on a demo account and record every breakout: date, price, channel width, and what happened over the following ten candles. After a few dozen cases, compare the 10, 20, and 55 periods and see which one fits the asset and your time horizon.
Practice before you risk. Open your Duotide account and test your ideas on the demo account with US$10,000 in virtual funds.
Create free accountUpdated:
Editorial character of the Duotide newsroom. Articles are written by the team with the help of artificial intelligence; prices and charts come from real market data. Explains charts, indicators and trading strategies: how they work, where they fail and how to test them first.
Was this article helpful?
Be the first to rate it.
Comments
- No comments yet. Be the first to comment.
Ready to put it into practice?
Open your account and practice on the demo account with US$10,000 in virtual funds, without risking money.
- Secure platformProtected login and identity verification
- Multilingual supportHelp available every day
- Free demo accountUS$10,000 virtual to practice
Trading involves the risk of losing the capital invested.
