

 Português pt
 Español es
 العربية ar
 বাংলা bn
 Deutsch de
 Filipino fil
 Français fr
 हिन्दी hi
 Bahasa Indonesia id
 Italiano it
 Русский ru
 Svenska sv
 ไทย th
 Türkçe tr
 Tiếng Việt vi
 简体中文 zh
Updated:
StrategiesHow to Test and Adjust Your Trading Strategy With a Backtest
 Naomi TanakaEditorial character · Analysis Desk

Quick answer
To test a strategy, write exact entry and exit rules, apply them to months of past chart data, and log every signal. With 30 or more trades, calculate the win rate and the average result per trade. Adjust parameters carefully, always checking against a period that wasn't used for the tuning, and calibrate the risk by the worst losing streak the test showed.
After choosing a strategy that fits your time, your capital, and your risk tolerance, the next step is to put it to the test before trading meaningful amounts. This is where a lot of people jump straight to real money and end up paying to learn what a simple test would have shown for free.
This is the second part of the guide on how to choose a strategy. To avoid staying purely theoretical, we ran a real backtest, with a simple rule applied to real daily S&P 500 quotes between October 8, 2025 and October 7, 2026. The result is a good example of what a test can reveal.
What a backtest is
A backtest is applying a strategy's exact rules to data that already happened to see how it would have behaved. It doesn't require programming: a historical chart and a spreadsheet are enough. The essential part is writing rules that leave no room for interpretation, and logging every signal, including the ones you'd rather ignore.

How to calculate a backtest's result
The rule tested was this:
- Entry: buy at the close on the day the price closes above the 20-day simple moving average, after having closed below it the day before.
- Exit: a target 2% above the entry or a stop 1% below, whichever comes first. If the market opens past either one, the exit is at the opening price.
With each trade's result logged, two metrics sum up the test:
- Win rate = winning trades ÷ total trades.
- Average result = sum of results ÷ total trades. It's what the rule yields, on average, per trade.
With a 2% target and a 1% stop, the break-even win rate is 1 ÷ (1 + 2) = 33.3%. Below that, the rule loses money.
The result with real data
Over one year, the rule generated 16 signals; 15 were closed and the last one, from October 2, 2026, was still open at the end of the data. Of the 15 closed trades, 3 hit the target and 12 got stopped out: a win rate of 20%. The sum of the results was −7.33%, an average result of −0.49% per trade. Over the same period, the S&P 500 itself rose 15.5%, from 6,753.72 to 7,801.77 points. The rule lost money in a rising market.
Real example: the signals on the S&P 500 chart
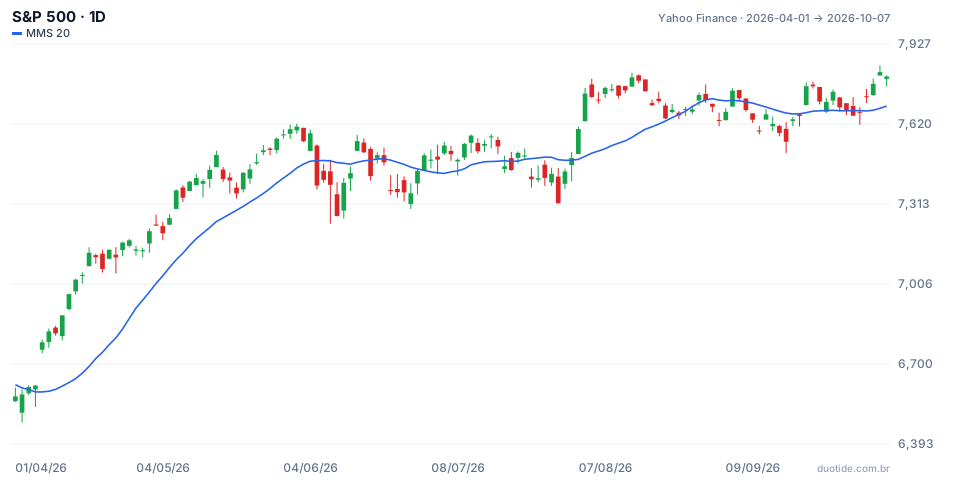
The chart shows the S&P 500 from April to October 2026 with the 20-day average in blue. The price crossing above the average marks the rule's signals. Three moments explain the result:
June and July: eight losses in a row
Between January 23 and July 21, 2026, the rule produced eight stops in a row. In June, the signals from June 15 (at 7,554.29 points) and June 18 (at 7,500.58) got stopped out within a few days, because the index kept crossing the average and coming back. In a market that rises slowly, without moving far from the average, the crossover happens often and almost always without any real force.
Stops bigger than 1%
Four losses came in above 1%: on June 23, for example, the index opened at 7,366.51, already below the stop for the June 18 trade, and the loss was 1.79%. In an honest test, opening gaps need to be included in the math.
August: the winner
The signal from July 31, at 7,489.72 points, hit the 2% target on August 4. It was the only winner between February and October. These are past results from a specific rule, not a forecast.

How to adjust the strategy after the test
Be careful when tweaking parameters
The temptation is to test other combinations until you find one that works. We did that to show the risk: we split the year in half. In the first half (October 2025 to April 2026), the best variation was a 4% target with a 2% stop, which broke even: one 4% gain and two 2% losses across three trades. Applied to the second half, the same variation had one win and four stops across the five closed trades, totaling −4%. The tweak that looked good in one period didn't repeat in the next. So tune on the early part of the history and always check against a stretch that wasn't used to pick the numbers.
Calibrate risk by the worst streak
The test showed eight consecutive losses, totaling −9.0% in changes. With R$2,000 in capital and a risk of 1% per trade (R$20), eight losses would cost at least R$160, 8% of capital. If that number feels heavy, reduce the risk per trade before moving to real money, always as a percentage of your current capital.
When to switch strategies
The criterion should be statistical, not emotional. Switching after every loss keeps you from building up enough signals to evaluate anything. A negative average result after 30 to 40 trades followed strictly, though, is a reason to review. It's also worth watching the type of market: a crossover rule can work in strong trends and fail in slow rallies, like the one in the example.
Limitations
Fifteen trades aren't enough for a firm conclusion. The backtest also doesn't show costs, spreads, or the emotional difficulty of sticking through eight losses in a row. And a past result, good or bad, doesn't guarantee the next period.
Common mistakes when testing a strategy
- Skipping signals that look bad on the chart and only logging the good ones.
- Testing with few trades and drawing a definitive conclusion.
- Tweaking the target, stop, and period until the test turns positive, without checking it against another stretch of data.
- Ignoring opening gaps and trading costs.
- Switching strategies after every loss, with no criteria.
- Not comparing the strategy with simply holding the asset over the same period.
To practice without risking money, write down your strategy's rules, apply them to a year of chart data, and then follow them for a few weeks on a demo account, logging every trade. Compare the win rate and average result from the two periods: if they agree, you'll have more confidence to move forward.
Practice before you risk. Open your Duotide account and test your ideas on the demo account with US$10,000 in virtual funds.
Create free accountUpdated:
Editorial character of the Duotide newsroom. Articles are written by the team with the help of artificial intelligence; prices and charts come from real market data. Explains charts, indicators and trading strategies: how they work, where they fail and how to test them first.
Was this article helpful?
Be the first to rate it.
Comments
- No comments yet. Be the first to comment.
Ready to put it into practice?
Open your account and practice on the demo account with US$10,000 in virtual funds, without risking money.
- Secure platformProtected login and identity verification
- Multilingual supportHelp available every day
- Free demo accountUS$10,000 virtual to practice
Trading involves the risk of losing the capital invested.
