

 Português pt
 Español es
 العربية ar
 বাংলা bn
 Deutsch de
 Filipino fil
 Français fr
 हिन्दी hi
 Bahasa Indonesia id
 Italiano it
 Русский ru
 Svenska sv
 ไทย th
 Türkçe tr
 Tiếng Việt vi
 简体中文 zh
Updated:
IndicatorsSTARC Bands: What They Are, How to Calculate and Use Them
 Naomi TanakaEditorial character · Analysis Desk

Quick answer
STARC Bands (Stoller Average Range Channel) form a channel around the price: a short simple moving average, usually 6 periods, with bands set 2 times the ATR away. When the price touches a band, it has moved further than its recent range usually allows. The most common reading is mean reversion, which works better in a sideways market than in a strong trend.
Among the lesser-known volatility indicators to the wider public, STARC Bands hold their own niche: they combine the simplicity of a short moving average with the ATR (Average True Range) to draw a channel that follows the market's real rhythm, instead of a fixed percentage. In this guide we use real daily S&P 500 quotes (from Yahoo Finance) between April and October 2026 to run the calculation and see what the channel actually showed.
What STARC Bands are
STARC stands for Stoller Average Range Channel, a channel created by Manning Stoller. The most-cited setup uses a 6-period simple moving average in the middle and a 15-period ATR to set the distance of the bands, with a multiplier of 2. Variations with a 5-period average or a 10-period ATR also show up on platforms.
The difference from Bollinger Bands lies in the volatility measure. Bollinger Bands use the standard deviation of closes; STARC Bands use the range of the bars, including highs, lows, and gaps. Because the central average is very short, the channel hugs the price closely and reacts within a few days when the market changes pace.

How to calculate STARC Bands
- True Range of the day: the largest of high − low, |high − previous close|, and |low − previous close|.
- ATR (15): average True Range over the last 15 days, using Wilder's smoothing.
- Middle line: simple average of the last 6 closes.
- Bands: middle line ± 2 × ATR.
Example with real S&P 500 data
On October 7, 2026, the index opened below the previous close. The high was 7,807.02, the low 7,763.34, and the previous day's close 7,818.93. The three distances are 43.68 points (high − low), 11.91 (high − previous close), and 55.59 (low − previous close). The True Range is the largest: 55.59 points. If you only looked at the candle's range, you'd get 43.68 and miss the gap.
The last six closes, from September 30 to October 7, were 7,651.54, 7,666.45, 7,722.72, 7,773.95, 7,818.93, and 7,801.77. They add up to 46,435.36, for an average of 7,739.23. The 15-period ATR that day was 67.23 points.
- Band distance = 2 × 67.23 = 134.46 points
- Upper band = 7,739.23 + 134.46 = 7,873.69
- Lower band = 7,739.23 − 134.46 = 7,604.77
- Channel width = 268.92 ÷ 7,739.23 = 3.47% of the average
Real example: the ATR and STARC Bands on the S&P 500
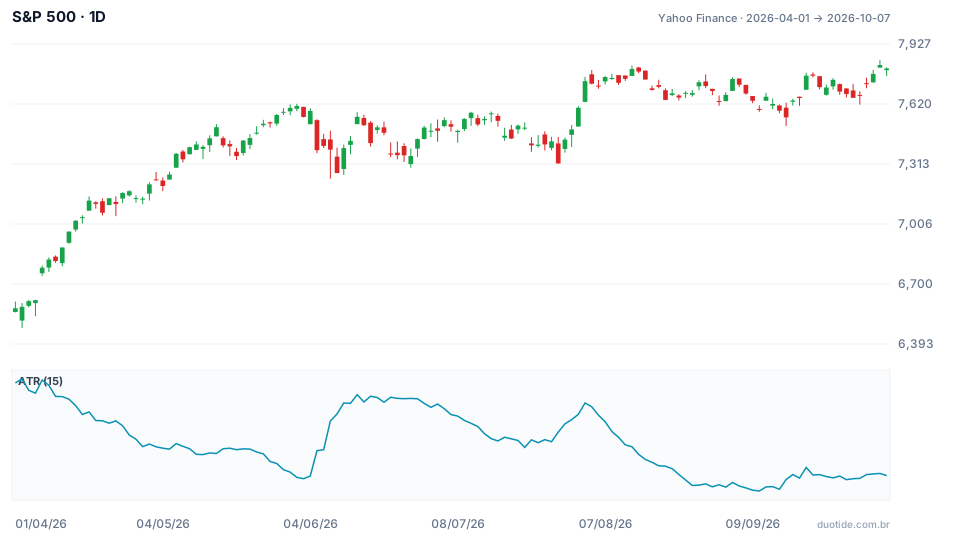
The chart shows the price and the 15-period ATR, which sets the channel's width. On April 2, 2026, the ATR stood at 105.03 points, the highest of the window; on September 10 it fell to 61.18, the lowest. With the same multiplier, September's channel was much narrower than April's. Over the period, the index rose 18.65%, from 6,575.32 to 7,801.77, and the price broke through the bands only a few times.
June: low below the lower band
On June 9, the day's low (7,237.85) pierced the lower band, which stood at 7,310.20, but the index closed at 7,386.65, back inside the channel. By June 12 it was already closing at 7,431.46, above the middle line. It was the classic mean-reversion setup: an intraday overshoot that unwound within three sessions. Ten sessions after the signal, though, the close was 7,358.22, 0.4% lower, showing the gain depended on exiting at the average, not on holding on.
August: a high above the upper band during a rally
On August 4, the high (7,758.21) broke above the upper band (7,692.80), and the close was 7,736.52. Anyone selling there expecting a move back to the average saw the high pierce the band again the next day (7,793.68). Through August 18, closes moved sideways between 7,691.76 and 7,798.99, and the middle line climbed until it caught up with the price. The reversion to the mean happened because the average moved, not because price fell: ten sessions later, the decline was only 0.58%.
September: narrow channel, shallow touch
On September 21, the high of 7,779.22 narrowly cleared the upper band (7,775.90), with the ATR near the window's lowest level. The close landed at 7,764.70, and ten sessions later the index was 0.12% higher. With a narrow channel, touches happen on smaller moves and say less.

How to use STARC Bands
Mean reversion in a sideways market
The most common reading: price at the upper band is stretched relative to its own recent pace, and price at the lower band is the mirror case. In a market without a trend, the natural target is the middle line, not the opposite band.
Trend filter
In an uptrend, ignore touches on the upper band and watch for pullbacks toward the lower band or the middle line. A longer average, such as the 50- or 200-period one, helps tell which regime the market is in.
Confirmation before the entry
Treat the touch as a warning, not an order. A reversal candle, a close back inside the channel, or a crossover of short averages all reduce the number of false signals.
Stop based on the ATR itself
The ATR is already calculated: a stop 1 ATR beyond the touched band gives a reference consistent with the moment's volatility. In the October 7 example, that would be about 67 points beyond the band.
Limitations
The 6-period average is so short that the channel moves along with the price; in a trend, the reversion to the mean usually comes from the average rising, as in August. The ATR also lags: after a day of large range, the bands widen and stay wide for several days.
Common mistakes when using STARC Bands
- Selling every touch on the upper band during an uptrend.
- Aiming for the opposite band as the target, when the middle line is the more realistic one.
- Comparing the channel with Bollinger Bands without remembering the central averages use different periods.
- Using the True Range as if it were just high minus low, forgetting about gaps.
- Sizing the position without considering the signal might simply be wrong.
To practice without risking money, open the chart of the asset you follow on a demo account, add STARC Bands (or a 6-period average plus the 15-period ATR), and note, over a few weeks, every touch on the bands and where the price stood three and ten sessions later. Your own numbers say more about the indicator than any ready-made rule.
Practice before you risk. Open your Duotide account and test your ideas on the demo account with US$10,000 in virtual funds.
Create free accountUpdated:
Editorial character of the Duotide newsroom. Articles are written by the team with the help of artificial intelligence; prices and charts come from real market data. Explains charts, indicators and trading strategies: how they work, where they fail and how to test them first.
Was this article helpful?
Be the first to rate it.
Comments
- No comments yet. Be the first to comment.
Ready to put it into practice?
Open your account and practice on the demo account with US$10,000 in virtual funds, without risking money.
- Secure platformProtected login and identity verification
- Multilingual supportHelp available every day
- Free demo accountUS$10,000 virtual to practice
Trading involves the risk of losing the capital invested.
