

 Português pt
 Español es
 العربية ar
 বাংলা bn
 Deutsch de
 Filipino fil
 Français fr
 हिन्दी hi
 Bahasa Indonesia id
 Italiano it
 Русский ru
 Svenska sv
 ไทย th
 Türkçe tr
 Tiếng Việt vi
 简体中文 zh
Updated:
Risk managementHow Much to Risk Per Trade: 1%, 2%, 5%, or 10%?
 Camila NascimentoEditorial character · Risk & Behavior Desk

Quick answer
Risking 1% to 2% of capital per trade lets you get through long losing streaks without wrecking the account: ten losses in a row at 1% cost 9.6% of the balance, while at 10% they cost 65.1% and require a 186.8% gain just to get back to the starting point. The percentage defines how much you lose if the stop is hit, and the position size comes from dividing that by the stop's distance.
Imagine two traders with the same strategy: same entries, same exits, same win rate, same sequence of results. The first risks 1% of capital per trade. After a bad week, the account is bruised, but intact, and he reviews his trades with a clear head. The second risks 10%. The same bad week turns into real damage, and every following trade carries the weight of recovering the loss. The strategy is identical; the result isn't.
The risk percentage per trade isn't a technical detail. It decides how long you survive a rough patch, how much you need to gain to recover, and how clearly you can think with an open position.
What Risk Per Trade Is
It's how much of your capital you lose if the stop is hit. It's not the position size. On a $10,000 account, risking 1% means losing at most $100 on that trade, whether the position is $2,000 or $20,000. What links the two is the stop's distance.

How to Calculate the Effect of a Losing Streak
When the risk is a fixed percentage of the current balance, the formula for the balance after a losing streak is:
Final balance = starting balance × (1 − risk) raised to the number of losses
With $10,000 and a 5% risk: after one loss, $9,500 is left; after ten losses in a row, 10,000 × 0.95 raised to the 10th = $5,987.37, a 40.1% drop. How much each streak eats up at each percentage:
- 3 losses in a row: 1%: −3.0%; 2%: −5.9%; 5%: −14.3%; 10%: −27.1%.
- 5 losses in a row: 1%: −4.9%; 2%: −9.6%; 5%: −22.6%; 10%: −41.0%.
- 10 losses in a row: 1%: −9.6%; 2%: −18.3%; 5%: −40.1%; 10%: −65.1%.
- 15 losses in a row: 1%: −14.0%; 2%: −26.1%; 5%: −53.7%; 10%: −79.4%.
Long Streaks Are More Common Than They Seem
With a 50% win rate, the chance of having at least one streak of 5 losses in a row over 200 trades is 96.6%; of 10 losses in a row, 9.0%. With a 40% win rate, the chance of 10 losses in a row over 200 trades rises to 38.0%. In other words: a bad streak isn't rare bad luck, it's a normal part of the statistics.
The Math of Recovery
Losses and gains aren't symmetrical. A 20% drop requires a 25% gain to get back to the starting point; a 40% drop, 66.7%. After ten losses in a row risking 10%, the account falls 65.1% and needs to rise 186.8% just to break even. For the same ten losses, the gain needed is 10.6% risking 1%, 22.4% risking 2%, and 67.0% risking 5%.

Real Example: Position Size with Bitcoin's ATR
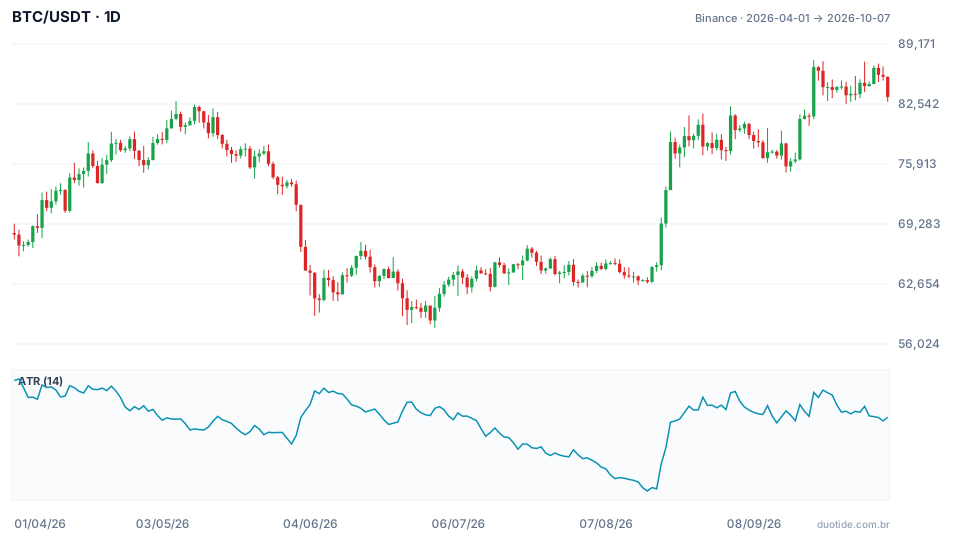
The chart shows bitcoin (BTC/USDT on Binance) from April to October 2026, with the 14-day ATR, which measures the average daily range. On October 7, 2026, BTC closed at $83,321.81 and the ATR stood at $2,187.23. A common rule is to place the stop at 1.5 ATR from the entry: 1.5 × 2,187.23 = $3,280.85 away.
Position size = amount risked ÷ stop distance. On a $10,000 account:
- 1% ($100): 100 ÷ 3,280.85 = 0.0305 BTC, a position of about $2,539.64.
- 2% ($200): 0.0610 BTC, about $5,079.29.
- 5% ($500): 0.1524 BTC, about $12,698.22, already bigger than the account itself.
- 10% ($1,000): 0.3048 BTC, about $25,396.45, two and a half times the capital.
Risking 5% or 10% with a reasonable technical stop, in this case, required leverage. And a 1.5 ATR move against the position isn't an extreme event: it's about a day and a half of normal swing for the asset at that time.
The Same Percentage Changes with Volatility
The ATR doesn't sit still. Over the chart's period, the highest value was $2,685.82, on April 2, and the lowest, $1,226.13, on August 16, with the price at $62,900. With August's ATR, the 1.5 ATR stop would sit $1,839.20 away, and risking 1% would allow for 0.0544 BTC, about $3,420. The risk rule stays fixed; the position size adjusts to volatility. These figures describe what happened, not the next move.
How to Choose Your Percentage
Ask the Ten-Losses Question
Before choosing, ask: if I have ten losses in a row, how much of the account am I willing to lose, and how much will I need to gain afterward? If the answer for 5% or 10% feels scary, the percentage is too high for your profile.
1% to 2% as a Starting Point
It's the range most cited by those who study risk management, because it lets you get through long streaks without jeopardizing your ability to keep trading. It feels slow to anyone wanting fast results, and it's exactly that slowness that protects you.
Limitations
The percentage only holds if the stop is respected. Gaps between one trading day and the next, news, and low liquidity can make the actual loss exceed the plan. And trades open at the same time in assets that move together add up the risk: three 2% positions in similar cryptocurrencies behave almost like one 6% position.
Common Mistakes with Risk Per Trade
- Confusing risk per trade with position size.
- Judging the risk by the pain of a single loss, instead of a streak.
- Increasing the percentage after losses to recover faster.
- Using the same position size with very different volatilities.
- Adding correlated positions without realizing the total risk has gotten high.
- Moving the stop farther away and, with that, risking more than the chosen percentage.
To feel the difference in practice, open a demo account, choose a percentage, and calculate each position's size from the stop's distance before entering. Log the trades for a few weeks and watch the losing streaks: the spreadsheet will show, with your own numbers, what each percentage does to the account.
Practice before you risk. Open your Duotide account and test your ideas on the demo account with US$10,000 in virtual funds.
Create free accountUpdated:
Editorial character of the Duotide newsroom. Articles are written by the team with the help of artificial intelligence; prices and charts come from real market data. Writes about risk management, position sizing and the psychology behind traders' decisions.
Was this article helpful?
Be the first to rate it.
Comments
- No comments yet. Be the first to comment.
Ready to put it into practice?
Open your account and practice on the demo account with US$10,000 in virtual funds, without risking money.
- Secure platformProtected login and identity verification
- Multilingual supportHelp available every day
- Free demo accountUS$10,000 virtual to practice
Trading involves the risk of losing the capital invested.
