

 Português pt
 Español es
 العربية ar
 বাংলা bn
 Deutsch de
 Filipino fil
 Français fr
 हिन्दी hi
 Bahasa Indonesia id
 Italiano it
 Русский ru
 Svenska sv
 ไทย th
 Türkçe tr
 Tiếng Việt vi
 简体中文 zh
Updated:
Risk managementATR Stop Loss: How to Calculate the Stop Distance
 Camila NascimentoEditorial character · Risk & Behavior Desk

Quick answer
An ATR-based stop sits at a distance equal to the ATR multiplied by a factor, usually between 1.5 and 3: for a long, stop = entry − ATR × multiplier. With ether at US$ 2,706.42 and an ATR of 90.78 on October 1, 2026, a 2 ATR stop would sit at US$ 2,524.86. Position size comes from the accepted risk divided by that distance, which lets the stop adjust to the moment's volatility.
One of the most common questions for those starting out is how far away to place the stop loss. Too close, and it gets hit by a normal swing in the asset. Too far, and the loss is large when the trade goes wrong. The ATR (Average True Range) gives an objective reference: how much the asset has moved per day, on average, over the last few weeks.
In this guide, every number comes from ether's real daily quotes (ETH/USDT on Binance) between April and October 2026, using the 14-period ATR.
What the ATR measures
The ATR measures the average size of the price move over a number of periods, usually 14. It doesn't indicate direction, only range. For each candle, the True Range is calculated as the largest of three values: high minus low, the distance between the high and the previous close, and the distance between the low and the previous close. The ATR is the average of these values, smoothed using Wilder's method.

How to calculate the stop with ATR
- Stop distance = ATR × multiplier
- Long: stop = entry price − distance
- Short: stop = entry price + distance
- Position size = money risk ÷ stop distance
The ATR calculated with real data
On October 7, 2026, ether had a high of US$ 2,699.80, a low of US$ 2,538.06, and the previous close was US$ 2,697.49. The three distances: 161.74 (high − low), 2.31 (high − previous close), and 159.43 (low − previous close). The True Range is 161.74. With the previous ATR at 80.86, the new ATR comes out to (80.86 × 13 + 161.74) ÷ 14 = 86.64, or 3.37% of the US$ 2,574.14 close.
Worked example: entry on October 1, 2026
Suppose a buy at the October 1 close, at US$ 2,706.42, with an ATR of 90.78 that day, on a US$ 10,000 account with a maximum risk of 1% per trade (US$ 100).
- 1 × ATR: distance 90.78 → stop at US$ 2,615.64 → position of 100 ÷ 90.78 = 1.10 ETH (about US$ 2,981)
- 1.5 × ATR: distance 136.17 → stop at US$ 2,570.25 → position of 0.73 ETH
- 2 × ATR: distance 181.56 → stop at US$ 2,524.86 → position of 0.55 ETH (about US$ 1,491)
- 3 × ATR: distance 272.34 → stop at US$ 2,434.08 → position of 0.37 ETH (about US$ 994)
In every case, if the stop is filled at the price, the loss is about US$ 100. What changes is the position size and the chance of the stop being hit.
Real example: ether's ATR in 2026
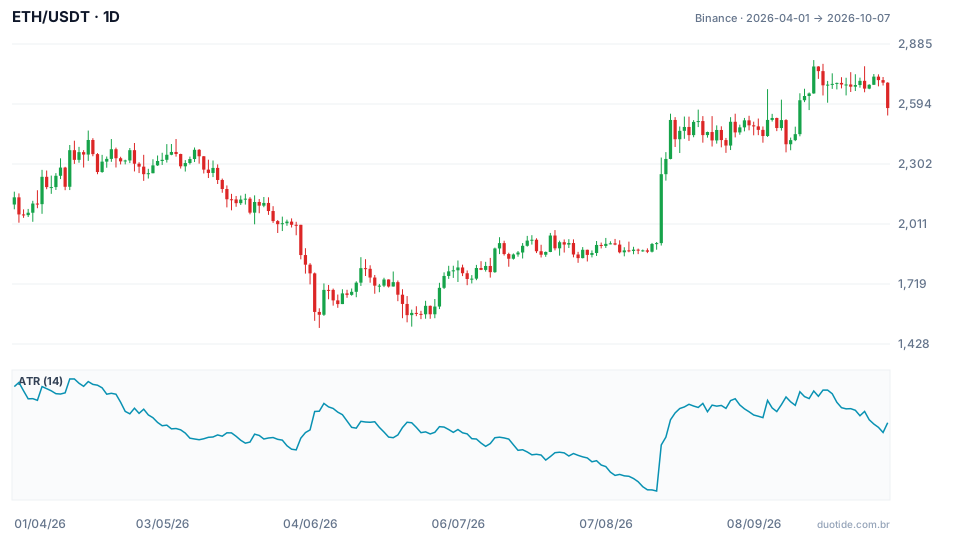
Over the chart's period, ether went from US$ 2,140.35 to US$ 2,574.14, with a low of US$ 1,505.68 on June 6 and a high of US$ 2,807.34 on September 21. Three moments show why an ATR-based stop adapts better than a fixed distance.
October: the multiplier decided the outcome
In the October 1 trade, the price moved sideways for five days and dropped sharply on October 7, with a low of US$ 2,538.06. The 1 and 1.5 ATR stops were both hit that day. The 2 ATR stop, at US$ 2,524.86, stayed US$ 13.20 below the low and was still standing at the October 7 close. That doesn't mean 2 ATR is the right number: it's what happened in this trade, in this period.
April and August: the same rule, very different distances
On April 14, the ATR reached 112.51, the window's highest value, 4.84% of the US$ 2,322.44 price. On August 18, it fell to 46.24, the lowest, just 2.41% of the US$ 1,917.85 price. A fixed US$ 100 stop would have been too wide in August and too tight in April; the 2 ATR stop sat at US$ 225 in one case and US$ 92 in the other.
August 19: the ATR lags
The day after the lowest ATR, ether jumped: a high of US$ 2,333.65 and a close of US$ 2,252.80, up 17.5%. A short opened on August 18 with a 2 ATR stop, at US$ 2,010.33, would have been hit right at the start of the move. The ATR only rose afterward, to 73.48 that same day and 97.54 on August 25. Low volatility in the indicator doesn't guarantee low volatility tomorrow.

How to use the ATR-based stop
Start with the chart's structure
The ATR answers how much the asset tends to move; it doesn't say where your idea is wrong. Mark the level that invalidates the trade first, such as a previous low, and use the ATR to check whether the distance makes sense. If the technical stop is less than 1 ATR away, it's probably too tight for normal noise.
Choose the multiplier before seeing the position
Set the multiplier based on the type of trade and the timeframe, and only then calculate the position. Choosing the multiplier to arrive at a comfortable size reverses the logic of risk management.
Use the ATR for the trailing stop too
A stop that trails the price at 2 or 3 ATR from the most recent high protects profit in a trend without sitting so close that it exits on every pullback.
Limitations
The calculation assumes execution at the stop price. Gaps, news, and fast moves can execute well away from it. And the ATR is calculated from past prices: it reacts after volatility changes, as on August 19.
Common mistakes when using an ATR-based stop
- Using the same multiplier for every asset and every timeframe without testing.
- Placing the ATR-based stop while ignoring support, resistance, and the chart's structure.
- Keeping the same position size with a larger multiplier, which increases the money risk.
- Calculating the True Range as just high minus low, forgetting the gaps.
- Assuming the multiplier that worked on one trade will always work: the examples above describe what happened, not what will happen.
To practice without risking money, use a demo account and, on every trade, note the day's ATR, the multiplier chosen, the position size, and whether the stop was hit. After a few dozen trades, compare the results by multiplier: this record shows which distance fits the asset and timeframe you trade.
Practice before you risk. Open your Duotide account and test your ideas on the demo account with US$10,000 in virtual funds.
Create free accountUpdated:
Editorial character of the Duotide newsroom. Articles are written by the team with the help of artificial intelligence; prices and charts come from real market data. Writes about risk management, position sizing and the psychology behind traders' decisions.
Was this article helpful?
Be the first to rate it.
Comments
- No comments yet. Be the first to comment.
Ready to put it into practice?
Open your account and practice on the demo account with US$10,000 in virtual funds, without risking money.
- Secure platformProtected login and identity verification
- Multilingual supportHelp available every day
- Free demo accountUS$10,000 virtual to practice
Trading involves the risk of losing the capital invested.
