

 Português pt
 Español es
 العربية ar
 বাংলা bn
 Deutsch de
 Filipino fil
 Français fr
 हिन्दी hi
 Bahasa Indonesia id
 Italiano it
 Русский ru
 Svenska sv
 ไทย th
 Türkçe tr
 Tiếng Việt vi
 简体中文 zh
Updated:
StrategiesCFD or Spot Market: Differences, Leverage, and an Apple Example
 Naomi TanakaEditorial character · Analysis Desk

Quick answer
In the spot market you buy the asset and pay its full value; with a CFD you only trade the price change, without owning the asset, and usually on margin. CFD leverage multiplies gains and losses relative to the money deposited and brings a swap cost every night. A spot purchase carries dividend rights and isn't subject to a margin call.
Buying a stock on the exchange and opening a CFD on that same stock might look like the same thing: both track the asset's price. The mechanism behind each one, though, is quite different, and that difference defines how much capital you need, how much you can lose, and which costs you'll pay.
To make the comparison concrete, we use Apple's real daily quotes (AAPL, from Yahoo Finance) between April and October 2026. Over that window the stock rose 31.7%, from US$ 255.63 to US$ 336.67, but along the way it had sharp drops, and that's where the difference between the two instruments shows up.
What the spot market is
In the spot market, you buy the actual asset. Anyone who buys a stock becomes the owner of a fraction of the company, entitled to dividends and, depending on the type of share, to a vote at shareholder meetings. Payment is in full: to hold US$ 10,000 in stock, you need to have US$ 10,000. If the price falls, your holdings shrink, but the position stays yours for as long as you want to keep it.

What a CFD is
CFD stands for contract for difference. You and the counterparty agree to exchange the difference between the position's opening price and its closing price. You never own the stock: you're only trading the price change. That lets you trade both the rise and the drop with the same ease and, above all, trade on margin, that is, deposit only a fraction of the position's value.
How to calculate the difference: an Apple example
Let's compare 30 Apple shares bought on the spot market with a CFD of the same exposure and 20% margin, which equals 5-to-1 leverage. Brokerage, spread, and swap costs are left out to isolate the effect of leverage.
When the price rises
- Entry on June 25, 2026, at US$ 275.15: 30 × 275.15 = US$ 8,254.50 of exposure.
- Exit on July 10, 2026, at US$ 315.32: 30 × 315.32 = US$ 9,459.60. A gain of US$ 1,205.10 (up 14.6%).
- Spot: the gain is 14.6% of the capital used (US$ 8,254.50).
- CFD: the margin is 20% of 8,254.50 = US$ 1,650.90, and the same gain represents 73.0% of the margin.
When the price falls
- Entry on July 29, 2026, at US$ 338.19: exposure of US$ 10,145.70.
- Ten sessions later, on August 12, the stock closed at US$ 302.25: position worth US$ 9,067.50, a loss of US$ 1,078.20 (down 10.6%).
- Spot: the loss is 10.6% of the capital, and the position stays open if you want to wait it out.
- CFD: the margin was US$ 2,029.14, and the loss ate up 53.1% of it. Depending on the platform's rules, the position could be closed before you decide to.
The gain and the loss in dollars are the same in both cases. What changes is the size of the result relative to the money you put up, and that effect cuts both ways.

Real example: Apple in 2026
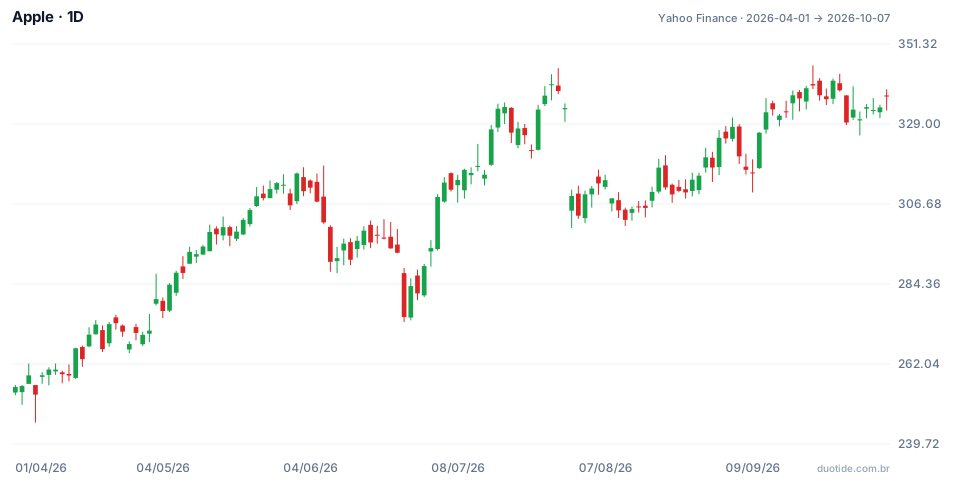
The chart shows that a six-month rally wasn't a straight line. Three stretches help explain why leverage changes the experience of trading it.
April: the period's low
The window's lowest quote came right at the start, US$ 245.70, on April 7. Anyone who bought on the spot market on April 1 sat on a loss for a few days before catching the rally. On a leveraged CFD, that same early pullback already eats up a much bigger chunk of the margin, and that's where a lot of people give up on the position.
July 31: a 7.35% drop in one day
On July 30, the stock closed at US$ 333.43; the next day, at US$ 308.91. On 30 shares, that's a loss of US$ 735.60 in one session. On the spot market, that was 7.35% of the capital. On the CFD with 20% margin (US$ 2,000.58), the loss was 36.8% of the margin. With 5% margin, a single day's loss would have been bigger than the entire deposited amount.
September: the period's high
The high came on September 22, at US$ 345.34, and the October 7 close was US$ 336.67. Anyone who held through the whole period on the spot market got the chart's result. Anyone who held it with a CFD also paid swap every night, a cost that a spot purchase doesn't have.
How to use each one
When the spot market makes more sense
For anyone who wants to hold the position for months or years, receive dividends, and not depend on margin calls. The maximum loss is the amount invested, and a temporary drop doesn't close the position.
When a CFD makes more sense
For short-term trades, for anyone who wants to trade the drop as easily as the rise, or for anyone who needs less capital tied up per position. It demands a defined stop, a calculated position size, and attention to overnight cost.
Different costs
Spot: brokerage, spread, and possible custody fees. CFD: spread, possible commission, and swap every night the position stays open. Over long holding periods, accumulated swap can weigh more than the entry spread.
Limitations of the comparison
The numbers above ignore costs and taxes, which vary by country and platform. Required margin also varies by asset and by regulation. And the examples describe what Apple did in 2026, not what it will do.
Common mistakes when comparing CFD and the spot market
- Looking only at the percentage gain on the margin and forgetting the loss grows by the same proportion.
- Using a CFD for a long-term position without calculating the accumulated swap.
- Thinking a CFD carries the same dividend and voting rights as the bought stock.
- Opening a leveraged position without a stop and without knowing how much of the margin a normal drop in the asset would eat up.
- Choosing the maximum available leverage just because it's there.
Before deciding, run these numbers again on a demo account with the asset you follow: open the same exposure with and without leverage, note how much each drop ate up of the capital, and log the cost of every night. The numbers in your own spreadsheet are worth more than any generic comparison.
Practice before you risk. Open your Duotide account and test your ideas on the demo account with US$10,000 in virtual funds.
Create free accountUpdated:
Editorial character of the Duotide newsroom. Articles are written by the team with the help of artificial intelligence; prices and charts come from real market data. Explains charts, indicators and trading strategies: how they work, where they fail and how to test them first.
Was this article helpful?
Be the first to rate it.
Comments
- No comments yet. Be the first to comment.
Ready to put it into practice?
Open your account and practice on the demo account with US$10,000 in virtual funds, without risking money.
- Secure platformProtected login and identity verification
- Multilingual supportHelp available every day
- Free demo accountUS$10,000 virtual to practice
Trading involves the risk of losing the capital invested.
