

 Português pt
 Español es
 العربية ar
 বাংলা bn
 Deutsch de
 Filipino fil
 Français fr
 हिन्दी hi
 Bahasa Indonesia id
 Italiano it
 Русский ru
 Svenska sv
 ไทย th
 Türkçe tr
 Tiếng Việt vi
 简体中文 zh
Updated:
Risk managementRisk Management in Trading: A Beginner's Guide with a Real Example
 Camila NascimentoEditorial character · Risk & Behavior Desk

Quick answer
Risk management means deciding how much you can lose before opening a trade. The most common rule is to risk 1% to 2% of capital per trade and calculate the position size by dividing that amount by the distance to the stop. That way, a losing streak shrinks the account without destroying it.
If there's one topic that separates those who stay in the market from those who quit after a few months, it's risk management. It's common for beginners to spend weeks studying indicators and chart patterns and only a few minutes thinking about how much they're willing to lose on each trade. That reversed priority is costly.
This guide treats risk management as the foundation, not a technical detail. For the practical example, we use real daily quotes for bitcoin (BTC/USDT on Binance) and the ATR, the average daily range, between April and October 2026.
What risk management in trading is
It's the set of rules that defines how much you can lose, on each trade and overall, before any analysis of price direction. There are four pillars:
- Risk per trade: the slice of capital you accept losing on a single trade, usually 1% to 2%.
- Risk-reward ratio: how much you aim to gain relative to what you risk.
- Position size: calculated from the accepted risk and the distance to the stop.
- Daily or weekly loss limit: a ceiling that, once hit, ends trading for that period.
Why risk matters more than the win rate
Someone who wins 40% of trades, but gains twice what they risk, has an average result of 0.4 × 2 − 0.6 × 1 = +0.2 times the risk per trade. Someone who wins 70%, but loses three times what they gain, ends up with 0.7 × 1 − 0.3 × 3 = −0.2. Winning more often isn't enough if the losses are disproportionate.

How to calculate position size
The formula is: size = risk in money ÷ stop distance. The size doesn't come from how much money is left in the account, but from the maximum risk and the stop.
Example with bitcoin's real ATR
A $5,000.00 account, 1% risk ($50.00), and a stop at 2 ATR from the entry price. On October 7, 2026, BTC closed at $83,321.81, with the 14-day ATR at $2,187.23.
- Stop distance: 2 × 2,187.23 = $4,374.46
- Quantity: 50.00 ÷ 4,374.46 = 0.01143 BTC
- Position value: 0.01143 × 83,321.81 = about $952.37
If the stop is hit, the loss stays near $50.00, even with a position worth almost $1,000.00. The same calculation changes with volatility: on August 16, 2026, with the ATR at its lowest level of the period ($1,226.13) and BTC at $62,900.00, the position would be 0.02039 BTC, about $1,282.49; on April 2, 2026, with the ATR at its highest level ($2,685.82) and BTC at $66,901.99, it would drop to 0.00931 BTC, about $622.73. The dollar risk didn't change; the size adjusted.
Real example: bitcoin's volatility in 2026
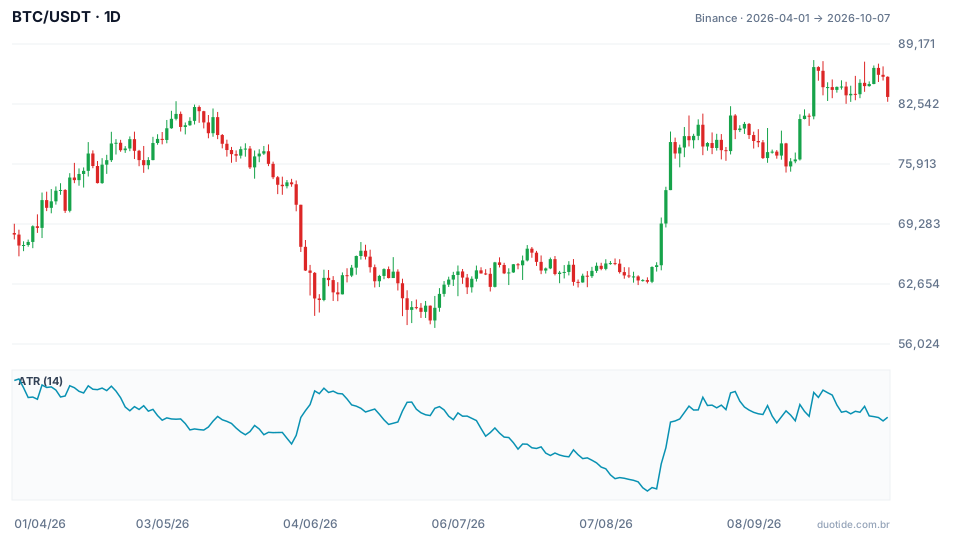
The chart shows BTC's daily price from April 1, 2026, to October 7, 2026, and, below, the 14-day ATR. Bitcoin started the period at $68,113.92, fell to $57,800.19 on July 1, rose to $87,395.67 on September 21, and closed October 7 at $83,321.81.
June 2: a two-ATR day
BTC closed June 1 at $71,408.90 and June 2 at $66,760.83, a drop of $4,648.07, or 6.5%, in a single day. That day's ATR was at $2,184.39, meaning the drop equaled a bit more than two ATRs. A 1-ATR stop would have been hit; a 2-ATR stop would have been right at the edge.
August: low ATR before strong up days
On August 16 the ATR marked the period's lowest value, $1,226.13. Three days later, on August 19, BTC rose 7.1% and closed at $69,334.79; on August 21 it rose another 7.3% and closed at $78,338.03. The ATR climbed back to $2,124.27. Low volatility doesn't last forever, and a position size calculated on a calm day gets too big once the market wakes up, which is why the calculation needs to be redone on every trade.

How to apply risk management
Understand the effect of losing streaks
Losing streaks happen even with good methods. With 1% risk per trade, ten losses in a row reduce capital by 9.6% (0.99 raised to 10 = 0.904), and it only takes a 10.6% gain to get back to the starting point. With 10% per trade, the same ten losses lead to a 65.1% drop (0.9 raised to 10 = 0.349), and it would take a 186.8% gain to recover.
Add up the risk of open positions
Five trades with 1% risk each look conservative, but if they're assets that tend to rise and fall together, like bitcoin and other cryptocurrencies, the real risk gets close to 5% in a single move. A spreadsheet that adds up the risk of all open positions helps keep that in view.
Set loss limits per period
A daily or weekly limit, for example 3% of capital, stops trading before frustration takes over the decisions.
Limitations
No risk rule guarantees profit. The ATR describes past volatility and doesn't prevent bigger jumps; in gapping or low-liquidity markets, the stop can fill beyond the set price. Risk management limits the damage of a bad streak, it doesn't eliminate losses.
Common risk management mistakes
- Increasing the position after a loss to recover fast, known as martingale.
- Moving the stop farther away mid-trade, hoping the price comes back.
- Setting the size by the available balance, instead of by the stop distance.
- Using the same position size on assets with very different volatility.
- Ignoring the correlation between open positions.
- Treating the examples above as a forecast: they describe what happened, not what will happen.
To build the habit, trade on a demo account calculating the size of each position with the formula above, and log the planned risk, the actual loss or gain, and the reason for each exit. After a few weeks, your own record shows whether you're respecting your own limit.
Practice before you risk. Open your Duotide account and test your ideas on the demo account with US$10,000 in virtual funds.
Create free accountUpdated:
Editorial character of the Duotide newsroom. Articles are written by the team with the help of artificial intelligence; prices and charts come from real market data. Writes about risk management, position sizing and the psychology behind traders' decisions.
Was this article helpful?
Be the first to rate it.
Comments
- No comments yet. Be the first to comment.
Ready to put it into practice?
Open your account and practice on the demo account with US$10,000 in virtual funds, without risking money.
- Secure platformProtected login and identity verification
- Multilingual supportHelp available every day
- Free demo accountUS$10,000 virtual to practice
Trading involves the risk of losing the capital invested.
