

 Português pt
 Español es
 العربية ar
 বাংলা bn
 Deutsch de
 Filipino fil
 Français fr
 हिन्दी hi
 Bahasa Indonesia id
 Italiano it
 Русский ru
 Svenska sv
 ไทย th
 Türkçe tr
 Tiếng Việt vi
 简体中文 zh
Updated:
Risk managementRisk-Reward vs. Win Rate: Which Decides Trading Profit
 Camila NascimentoEditorial character · Risk & Behavior Desk

Quick answer
Neither one decides profit alone: what decides it is expectancy, which combines the win rate with the risk-reward ratio. At 1:1 you need to win more than 50% to profit; at 1:2, more than 33.3%; at 1:3, more than 25%. Since longer targets get hit less often, a bigger ratio doesn't guarantee a better result.
There's a piece of advice repeated in almost every trading group: always go for a risk-reward ratio of at least 1 to 3. On its own, the advice isn't wrong, but it isn't the whole truth either. It was born from trend strategies, which win rarely and win big when they do. Applied to any style, it becomes a problem.
The risk-reward ratio on its own says little about whether a strategy is worth it. It only gains meaning when checked against that setup's real win rate. In this guide, we show the math that ties the two together and test a simple rule with bitcoin's real daily quotes, to see what happens to the win rate as the target gets farther away.
What risk-reward and win rate are
The risk-reward ratio compares the size of the gain at the target with the size of the loss at the stop. At 1:2, you risk 1 to go after 2. The win rate is the percentage of trades that end in profit.
The two move in opposite directions: the farther the target, the harder it is for the price to reach it before hitting the stop. That's why it makes no sense to pick one without looking at the other.
How to calculate a strategy's expectancy
The math that ties the two together is expectancy, measured in R (the amount risked per trade):
- Expectancy = (win rate × average gain in R) − (loss rate × average loss in R).
- Minimum win rate to break even = 1 ÷ (1 + ratio). At 1:1, 50%; at 1:2, 33.3%; at 1:3, 25%.
Examples: a 60% win rate at 1:1 gives 0.6 × 1 − 0.4 × 1 = +0.2R per trade. A 20% win rate at 1:3 gives 0.2 × 3 − 0.8 × 1 = −0.2R. The strategy with the nice-looking ratio loses money; the one with the modest ratio makes it.
The stop with bitcoin's real ATR
For the test below, the stop sits at 1.5 times the 14-day ATR (the average daily range). On October 7, 2026, BTC/USDT closed at $83,321.81 with an ATR of $2,187.23. Stop: 1.5 × 2,187.23 = $3,280.84, at $80,040.97. Target at 1:2: 83,321.81 + 2 × 3,280.84 = $89,883.49.
Real example: 1:1, 1:2, and 1:3 on bitcoin
We tested a mechanical rule, for study purposes only: buy at the close every 5 days, from January 1, 2025 to October 7, 2026, with a stop at 1.5 ATR and a target of 1, 2, or 3 times the risk. Over that span, BTC went from $94,591.79 to $83,321.81 (−11.9%), passing through a high of $126,199.63 on October 6, 2025 and a low of $57,800.19 on July 1, 2026. Trades still open on October 7 were left out.
- 1:1: 127 trades, 63 wins, a 49.6% rate (break-even minimum: 50%). Expectancy: −0.008R, practically zero.
- 1:2: 125 trades, 49 wins, a 39.2% rate (minimum: 33.3%). Expectancy: +0.176R.
- 1:3: 124 trades, 33 wins, a 26.6% rate (minimum: 25%). Expectancy: +0.065R.
The win rate dropped by almost half between 1:1 and 1:3. The 1:3 setup, which many people treat as the standard, ended up only 1.6 points above the break-even minimum. With a hypothetical cost of 0.1R per trade (spread and fees), both 1:1 and 1:3 would turn negative, and only 1:2 would stay positive. That doesn't make 1:2 a universal rule: it's the result of one asset, one period, and one simple entry rule.
Streaks matter too. In the test, the longest run of losses in a row was 15 trades at 1:1 (entries from January 21, 2025 to April 1, 2025) and 25 at 1:3 (entries from October 3, 2025 to January 31, 2026, right after the period's all-time high). Since entries were frequent and the price was falling, the losses came in a cluster.
Bitcoin's ATR in 2026
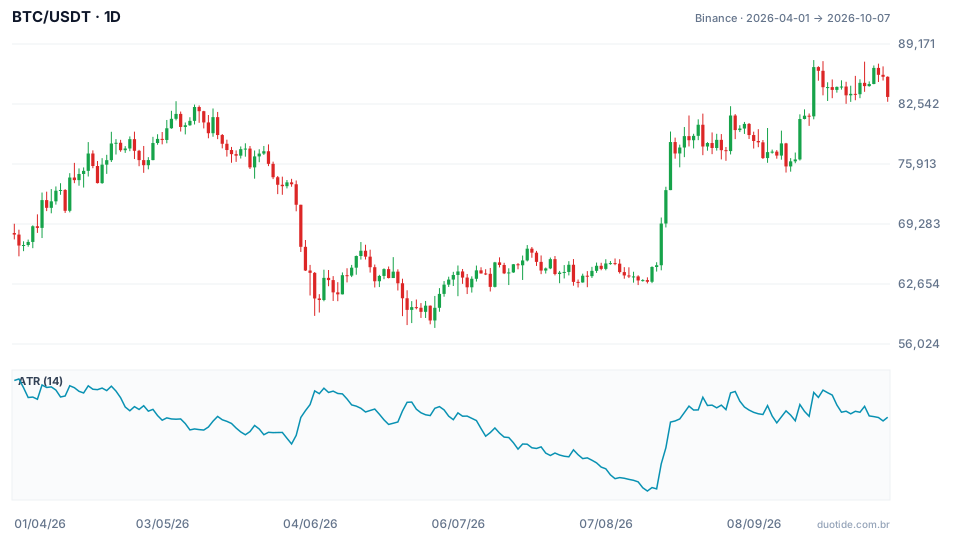
The chart shows BTC/USDT from April to October 2026 with the 14-day ATR. The ATR reached $2,685.82 on April 2 and fell to $1,226.13 on August 16. With a 1.5 ATR stop, that means a stop of about 6.0% of the price in April and 2.9% in August. The same stop rule produces trades of very different sizes, and position size needs to keep up.

How to use risk-reward and win rate together
Measure your real win rate
The rate that matters is the one from your own trades, with your setup and your asset. Record at least 50 to 100 trades before drawing conclusions; with fewer, natural variance is misleading.
Choose the target based on the market, not the number
The target should sit where the price has room to reach: ahead of a relevant resistance, for example. If resistance is at 1.5 times the risk, forcing a 3-times target just lowers the win rate.
Prepare for the streaks
The lower the win rate, the longer the losing streaks. With a 26.6% win rate, 25 losses in a row happened in the test. Risking 1% per trade keeps a streak like that bearable; risking 5% doesn't.
Include the costs
Spread, commissions, and slippage are charged on every trade, win or lose. In short-target strategies, they eat up a bigger share of the gain.
Limitations
The test only uses long trades, a single asset, and a period with a sharp drop in the middle; in another market or another phase, the numbers would be different. It also resolves trades using daily candles, without knowing the order of prices within the day. And past results don't say what the win rate will be going forward.
Common mistakes with risk-reward and win rate
- Demanding 1:3 on every trade without measuring how often the target is actually reached.
- Celebrating a high win rate without looking at the size of the losses.
- Drawing conclusions from 10 or 20 trades.
- Ignoring costs, which turn small expectancies negative.
- Underestimating the losing streaks of low-win-rate strategies.
- Changing the stop and target mid-trade and then calculating the statistics as if nothing had changed.
To practice without risking money, set an entry rule, stop, and target in a demo account and record each trade in R. After a few dozen, calculate your win rate, your average ratio, and your expectancy. The numbers above describe what happened with bitcoin between 2025 and 2026, not what will happen.
Practice before you risk. Open your Duotide account and test your ideas on the demo account with US$10,000 in virtual funds.
Create free accountUpdated:
Editorial character of the Duotide newsroom. Articles are written by the team with the help of artificial intelligence; prices and charts come from real market data. Writes about risk management, position sizing and the psychology behind traders' decisions.
Was this article helpful?
Be the first to rate it.
Comments
- No comments yet. Be the first to comment.
Ready to put it into practice?
Open your account and practice on the demo account with US$10,000 in virtual funds, without risking money.
- Secure platformProtected login and identity verification
- Multilingual supportHelp available every day
- Free demo accountUS$10,000 virtual to practice
Trading involves the risk of losing the capital invested.
