

 Português pt
 Español es
 العربية ar
 বাংলা bn
 Deutsch de
 Filipino fil
 Français fr
 हिन्दी hi
 Bahasa Indonesia id
 Italiano it
 Русский ru
 Svenska sv
 ไทย th
 Türkçe tr
 Tiếng Việt vi
 简体中文 zh
Updated:
Risk managementRisk-Reward Ratio: What It Is and How to Calculate It
 Camila NascimentoEditorial character · Risk & Behavior Desk

Quick answer
The risk-reward ratio compares how much you can lose at the stop with how much you can gain at the target on a trade. A 1:2 ratio means risking 1 to go after 2, and it needs at least a 33.3% win rate to break even, not counting costs. It only makes sense together with the real win rate and with the stop and target set before entering.
Many people who start trading focus on just one question: am I going to win or lose this trade? There's an earlier question, just as important: if I lose, how much do I lose, and if I win, how much do I gain? That comparison is the risk-reward ratio, and it decides whether a strategy makes sense in the long run, even when the win rate looks low.
In this guide, we use Apple's (AAPL) real daily quotes between April and October 2026 to calculate the stop, target, and position size with real numbers, and show what happened after three hypothetical entries.
What the risk-reward ratio is
Before entering any trade, you set two exit points: the stop, if it goes wrong, and the target, if it goes right. The distance between the entry and the stop is the risk; the distance between the entry and the target is the potential return. The ratio between the two is usually written as 1:2, 1:3, and so on: risking 1 to go after 2 or 3.
Many traders call the amount at risk R. A trade that earns twice what it risked returned +2R; one that hit the stop returned −1R. Thinking in terms of R lets you compare trades of different sizes.

How to calculate the risk-reward ratio
- Risk per share = entry price − stop price (on a long trade).
- Return per share = target price − entry price.
- Ratio = return ÷ risk.
- Minimum win rate to break even = 1 ÷ (1 + ratio). At 1:1, 50%; at 1:2, 33.3%; at 1:3, 25%. Not counting costs.
Example with Apple's real ATR
An objective way to place the stop is to use the ATR (average true range), which measures how much the asset moves per day. On May 29, 2026, AAPL closed at $312.06 with a 14-day ATR of $5.57.
- Stop at 1.5 ATR: 1.5 × 5.57 = $8.35 → stop at $303.71.
- Target at twice the risk: 2 × 8.35 = $16.70 → target at $328.76.
- $10,000 account risking 1% ($100): 100 ÷ 8.35 = 11.98 → 11 shares, real risk of $91.85.
- If the target had been reached, the gain would be 11 × 16.70 = $183.70, or about +2R.
Real example: three entries on Apple in 2026
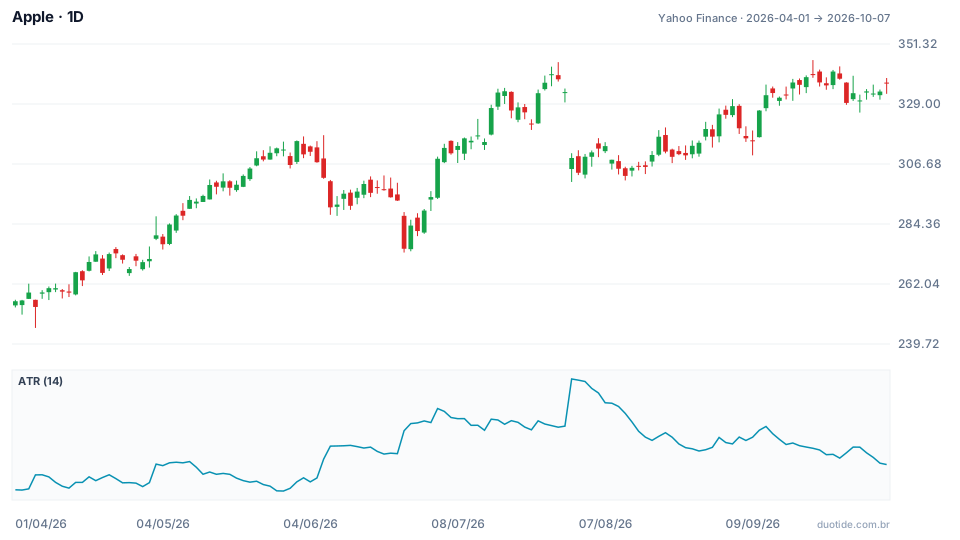
The chart shows AAPL and, in the panel below, the 14-day ATR. The ATR went from $5.57 at the end of May, the lowest value in the period, to $9.87 on July 31, the highest. We applied the same rule (buy at the close, stop at 1.5 ATR, target at twice the risk) on three dates. These aren't recommendations: they're examples of what happened.
May 29: the stop was hit
Entry at $312.06, stop at $303.71, and target at $328.76. The price never reached the target: on June 8 the low was $301.17 and the stop was triggered, a loss of 1R. The next day, June 9, the stock fell as low as $287.78. The stop limited the loss to under $100 in a decline that kept going.
July 2: the target was hit
Entry at $308.63, with a higher ATR of $8.74. Stop at 1.5 ATR = $13.10, at $295.53; target at $334.84. With the same $100 risk, the position drops to 7 shares (100 ÷ 13.10 = 7.6). On July 17 the high was $334.99 and the target was hit: a gain of 2R. With a 1:1 target, the exit would have come on July 13, with half the gain.
August 19: target hit, but slowly
Entry at $316.83, ATR of $7.67, stop at $305.33, and a 1:2 target at $339.83. The target was only reached on September 22, with a high of $345.34, more than a month later. A 1:3 target ($351.33) was never reached through October 7: the farther the target, the lower the odds it gets hit.
Adding up the three: −1R + 2R + 2R = +3R. Three trades are too small a sample to say anything about the rule; they just show the mechanics.

How to use the risk-reward ratio
Set the stop and target before entering
If you can't say where you'll get out if it goes wrong, you don't have a trade yet, you have a guess. Write down both prices before you click.
Place the stop where the idea stops being valid
The stop shouldn't sit at the point that makes the ratio look nice, but where the market shows you were wrong: below a support level, beyond 1 to 2 ATR. Then adjust the position size so that distance fits the risk you've chosen.
Check the ratio against your win rate
A 1:3 ratio is useless if the target is almost never reached. What matters is expectancy: (win rate × average gain) − (loss rate × average loss). With a 40% win rate at 1:2, the expectancy is 0.4 × 2 − 0.6 × 1 = +0.2R per trade, before costs.
Limitations
A stop doesn't guarantee the exit price: on gaps, the order can be filled well below it. On July 31, 2026, for example, AAPL closed the previous day at $333.43 and opened at $304.81, an 8.6% drop: a stop at $320 would have been filled near the open, far below the planned price. The planned ratio also isn't the ratio you actually get, because many trades exit before the target. And costs like spread and fees reduce the gain on every trade, especially when the stop is tight.
Common mistakes with the risk-reward ratio
- Pushing the target farther out just to make the ratio read 1:3, without checking whether the price has room to get there.
- Tightening the stop to improve the ratio and getting stopped out by the day's normal movement.
- Moving the stop farther away when the price gets close to it.
- Using the same number of shares on every trade, instead of adjusting size based on the stop distance.
- Judging the ratio without the win rate, as if one were enough on its own.
- Forgetting costs and slippage when calculating the expected return.
To practice without risking money, open the chart of the asset you follow in a demo account, add the ATR, and before each trade, write down the entry, stop, target, position size, and result in R. After a few dozen trades, your actual win rate and average ratio say more than any ready-made rule. The examples above describe what happened, not what will happen.
Practice before you risk. Open your Duotide account and test your ideas on the demo account with US$10,000 in virtual funds.
Create free accountUpdated:
Editorial character of the Duotide newsroom. Articles are written by the team with the help of artificial intelligence; prices and charts come from real market data. Writes about risk management, position sizing and the psychology behind traders' decisions.
Was this article helpful?
Be the first to rate it.
Comments
- No comments yet. Be the first to comment.
Ready to put it into practice?
Open your account and practice on the demo account with US$10,000 in virtual funds, without risking money.
- Secure platformProtected login and identity verification
- Multilingual supportHelp available every day
- Free demo accountUS$10,000 virtual to practice
Trading involves the risk of losing the capital invested.
