

 Português pt
 Español es
 العربية ar
 বাংলা bn
 Deutsch de
 Filipino fil
 Français fr
 हिन्दी hi
 Bahasa Indonesia id
 Italiano it
 Русский ru
 Svenska sv
 ไทย th
 Türkçe tr
 Tiếng Việt vi
 简体中文 zh
Updated:
IndicatorsSTARC Bands or Bollinger Bands: Differences and Which to Use
 Naomi TanakaEditorial character · Analysis Desk

Quick answer
Bollinger Bands measure volatility through the standard deviation of closes around a 20-period average; STARC Bands use the ATR, which includes highs, lows, and gaps, around a short 6-period average. Bollinger is more often used to spot volatility compression (the squeeze); STARC, to measure short-term excess. Neither is always better: the choice depends on the asset, the timeframe, and the type of trade.
Anyone who opens a chart and sees two lines wrapping around the price like a corridor tends to confuse STARC Bands (Stoller Average Range Channel) with Bollinger Bands. Visually they look alike: a central line and two bands, one above and one below. The way each one measures volatility, though, changes the timing and frequency of the signals quite a bit.
To compare them without made-up numbers, we calculated both over the real daily quotes of Nvidia (NVDA, from Yahoo Finance) between April and October 2026, a period in which the stock rose 35.12%, from US$ 175.75 to US$ 237.47.
What changes in the calculation
Bollinger Bands
They start from a 20-period simple moving average and add and subtract 2 standard deviations of the closes over that same period. Standard deviation measures the dispersion of closes around the average, and reacts strongly to a single close that's far from it.
STARC Bands
They use a much shorter simple average, usually 6 periods, and add and subtract 2 times the 15-period ATR (average true range). The ATR measures the average size of the bars, including highs, lows, and gaps, and doesn't depend on where the price closed relative to the average.

How to calculate both on the same day
On October 7, 2026, Nvidia closed at US$ 237.47. Each indicator's numbers for that day:
- Bollinger (20, 2): 20-day average = US$ 225.58; standard deviation = US$ 8.14. Bands = 225.58 ± 16.28 → US$ 241.86 and US$ 209.30. Width: 14.43% of the average.
- STARC (6, 15, 2): 6-day average = US$ 234.80; 15-day ATR = US$ 5.67. Bands = 234.80 ± 11.34 → US$ 246.14 and US$ 223.46. Width: 9.66% of the average.
Two differences show up right away. STARC's average sits US$ 9.22 above Bollinger's, because six days track the price much more closely than twenty do during a rally. And the STARC channel is narrower: after weeks of gains, closes were spread out relative to the 20-day average, which widens Bollinger, while the daily bars kept a moderate range, which keeps the ATR low.
Real example: STARC and Bollinger on Nvidia in 2026
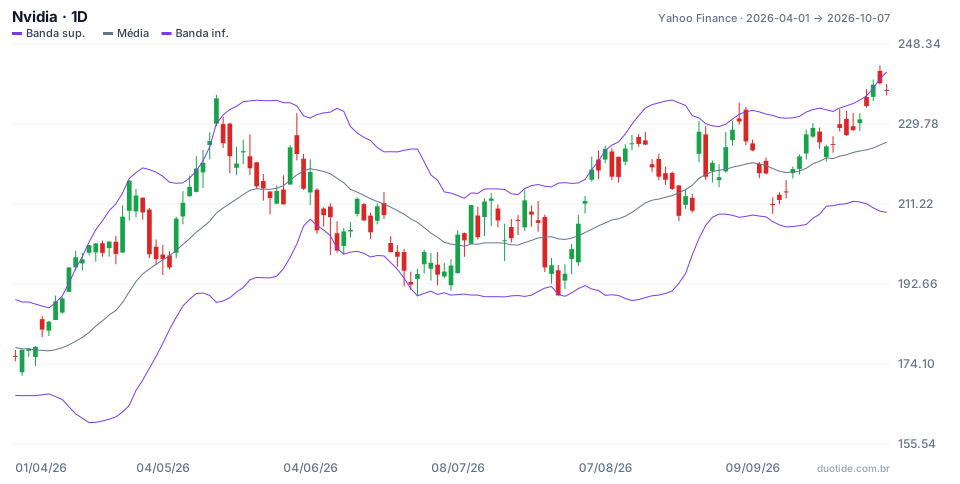
The chart shows Bollinger Bands. Compared with STARC calculated on the same data, four days sum up how the two indicators diverge.
April 14: only Bollinger flagged the excess
The stock closed at US$ 196.51, above Bollinger's upper band (US$ 192.90). STARC was at US$ 197.30 and wasn't touched. Ten sessions later, Nvidia was 8.48% higher. Anyone selling on Bollinger's signal would have fought the rally.
May 14: both agreed
The close of US$ 235.74 broke above Bollinger's upper band (US$ 229.85), and the high of US$ 236.54 pierced STARC (US$ 235.64). Ten sessions later, on May 29, the stock closed at US$ 211.14, down 10.44%. When both channels flag excess at the same time, the move is stretched by both volatility measures.
July 29: Bollinger touched, STARC not
Nvidia closed at US$ 190.01, US$ 0.19 below Bollinger's lower band. STARC's lower band stood at US$ 186.83, far from the day's low. Over the next ten sessions, the stock rose 17.94%, to US$ 224.09 on August 12. Here the more sensitive signal was the one that preceded the reaction, which shows neither indicator is always better.
August 27: STARC touched on a gap day
The stock opened sharply higher and the high reached US$ 230.47, US$ 20.81 above the previous close: the largest True Range of the window. That pierced STARC (US$ 229.68), but Bollinger (US$ 231.20) wasn't touched. Ten sessions later, the decline was 4.25%. The ATR captures gaps; the standard deviation of closes doesn't.

How to choose between the two
To spot volatility compression
Bollinger tends to be more straightforward. The squeeze, when band width drops to its lowest level in months, is the indicator's best-known reading and tends to precede breakouts, without saying which direction.
To trade short-term excess
STARC, with its 6-period average, measures how far the price has strayed from its own pace over the last few days. It's more useful for short mean-reversion entries, targeting the middle line.
For assets with frequent gaps
Stocks that open with jumps after earnings or news carry risk hidden in those gaps. The ATR folds those jumps into the channel's width; standard deviation only sees the close.
Limitations of both
Neither predicts the future: both describe recent volatility. In a strong trend, the price can hug either one for many days. And both depend on the chart's timeframe: the same settings on a 5-minute chart and a daily chart measure different things.
Common mistakes when comparing STARC and Bollinger
- Thinking they're the same indicator under different names: the volatility measure and the average's period both change.
- Comparing signals without noticing that STARC's middle line (6 periods) sits much closer to the price than Bollinger's (20 periods).
- Treating any touch, on either one, as a buy or sell order.
- Choosing the indicator based on the outcome of a single example, like the four days above.
- Changing the period and the multiplier at the same time, without knowing which change affected the result.
To decide with your own data, open both indicators on the same chart in a demo account, on the assets you follow, and note, over a few weeks, every touch on each channel and what the price did ten sessions later. The examples above describe what happened with Nvidia, not what will happen, and your own record is what will show which channel fits your style.
Practice before you risk. Open your Duotide account and test your ideas on the demo account with US$10,000 in virtual funds.
Create free accountUpdated:
Editorial character of the Duotide newsroom. Articles are written by the team with the help of artificial intelligence; prices and charts come from real market data. Explains charts, indicators and trading strategies: how they work, where they fail and how to test them first.
Was this article helpful?
Be the first to rate it.
Comments
- No comments yet. Be the first to comment.
Ready to put it into practice?
Open your account and practice on the demo account with US$10,000 in virtual funds, without risking money.
- Secure platformProtected login and identity verification
- Multilingual supportHelp available every day
- Free demo accountUS$10,000 virtual to practice
Trading involves the risk of losing the capital invested.
