

 Português pt
 Español es
 العربية ar
 বাংলা bn
 Deutsch de
 Filipino fil
 Français fr
 हिन्दी hi
 Bahasa Indonesia id
 Italiano it
 Русский ru
 Svenska sv
 ไทย th
 Türkçe tr
 Tiếng Việt vi
 简体中文 zh
Updated:
StrategiesWhat Is a Trading Algorithm and How It Works
 Naomi TanakaEditorial character · Analysis Desk

Quick answer
A trading algorithm is a set of exact rules that defines when to enter, when to exit, and how much to risk, with no room for interpretation. It can be followed by hand or run by a bot. What makes an algorithm good isn't the win rate, but the relationship between average gains and losses, tested over long periods and with costs included.
The term trading algorithm sounds more complicated than it is. At its core, it's a sequence of rules that decides when to buy, when to sell, and how much to risk, without relying on in-the-moment intuition. It can be as simple as a moving-average crossover or as complex as a statistical model with dozens of variables.
To show how an algorithm really behaves, we tested a simple rule on Apple's real daily quotes (AAPL, Yahoo Finance data) between January and October 2026, logging each trade: date, entry price, exit price, and result.
What a Trading Algorithm Is
It's the translation of a trading idea into precise, testable rules. Three terms are often mixed up:
- Strategy: the general idea, for example, buying assets in an uptrend.
- Algorithm: the idea written out with exact numbers, with no room for interpretation. Which average, how many periods, when to exit.
- Bot: the program that runs the algorithm automatically.
You can follow an algorithm with no bot at all, applying the rules by hand on every trade. Many traders do this: they use the algorithm's logic but press the button themselves.
Common Types of Algorithms
- Trend followers: buy when the price rises consistently and exit when the trend loses strength, usually using moving averages.
- Mean reversion: start from the idea that price returns to an average after an overshoot; they buy sharp drops and sell overextended rallies.
- Arbitrage: exploit price differences for the same asset across different markets; they require very fast execution and low costs.

How to Build and Test a Simple Algorithm
The rule we tested is a trend follower using two exponential moving averages (EMA), the 20-day and the 50-day:
- Entry: buy at the close of the day the 20-day EMA crosses above the 50-day EMA.
- Exit: sell at the close of the day the 20-day EMA crosses below the 50-day.
- Long only: out of the position whenever the short average is below the long one.
It's a rule that fits in three lines and leaves no doubt on any given day. That's the first quality of an algorithm.
Real Example: the Algorithm on Apple Stock in 2026
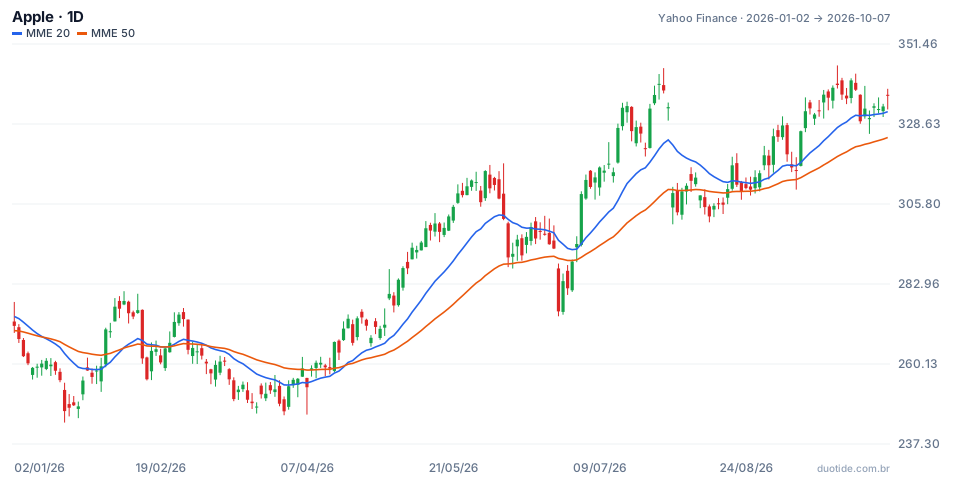
The chart shows the stock with the 20-day EMA (blue) and the 50-day (orange). Over the period, the rule generated three trades:
Trade 1: Entry on 02/06, Exit on 02/20
Buy at $278.12 and sell at $264.58. A loss of $13.54 per share, or 4.87%. The bullish crossover came almost at the top of a short bounce.
Trade 2: Entry on 02/23, Exit on 03/06
One session after the exit, the averages crossed upward again. Buy at $266.18 and sell at $257.46: a 3.28% loss. This is the so-called whipsaw: in a directionless market, the averages cross several times, and each crossover costs a little.
Trade 3: Entry on 04/20, Still Open
Buy at $273.05. On 10/07 the stock closed at $336.67, a 23.3% unrealized gain. The rule also stayed out of the year's bottom: the window's lowest closing price was $246.63, on 03/30, when the algorithm had no position.
The Tally
One winning trade and two losing ones: a 33% win rate. Even so, the cumulative result was positive: 0.9513 × 0.9672 × 1.2330 = 1.1345, or about 13.4% before costs. Over the same period, anyone who simply bought on 01/02 at $271.01 and held until 10/07 made 24.23%. The algorithm lost to buy and hold here, and it's important to know that before using it, not after.

How to Evaluate an Algorithm
Expectancy, Not Win Rate
The calculation that matters is expectancy per trade: (win rate × average gain) − (loss rate × average loss). In the test above, with an average gain of 23.3% and an average loss of 4.08%, the expectancy was about 5% per trade, even while losing two out of every three times. Three trades, though, are too small a sample to conclude anything.
Test Over Long and Different Periods
The test needs to include uptrends, downtrends, and sideways markets. A rule tested only in an uptrend will look great until the first sideways market.
Include Costs
Commissions, spread, and slippage apply to every entry and exit. With a hypothetical cost of 0.1% per side, the three trades above would lose about 0.6 percentage point. In algorithms that trade many times a day, costs can eat up the entire result.
Be Wary of Ready-Made Algorithms
Before using a ready-made algorithm sold to you, ask for the full trade history, not just the good months, and check whether the period includes sharp drops. The platform where orders are executed doesn't change the quality of the rules.
Limitations
A backtest always fits the past better than reality: it's easy to unintentionally pick the parameters that worked in that particular period. Markets change behavior, and a rule that worked for six months can stop working. And real execution has delay and slippage that the test doesn't show.
Common Mistakes With Trading Algorithms
- Judging an algorithm by its win rate and ignoring the size of gains and losses.
- Testing over just a few months, or only in an uptrend.
- Tweaking the parameters until the test looks perfect, which usually fails in the real market.
- Forgetting the costs of each trade.
- Abandoning the rules after two losses in a row, which fall within what's expected.
- Comparing the algorithm against nothing: always compare it with simple buy and hold.
- Forgetting that the examples above describe what happened, not what will happen.
To practice, write your rule in a few lines, apply it by hand on an asset's chart in a demo account, and log every trade with date, entry price, exit price, and result. Only think about automating it once the log shows, with data, that the logic makes sense.
Practice before you risk. Open your Duotide account and test your ideas on the demo account with US$10,000 in virtual funds.
Create free accountUpdated:
Editorial character of the Duotide newsroom. Articles are written by the team with the help of artificial intelligence; prices and charts come from real market data. Explains charts, indicators and trading strategies: how they work, where they fail and how to test them first.
Was this article helpful?
Be the first to rate it.
Comments
- No comments yet. Be the first to comment.
Ready to put it into practice?
Open your account and practice on the demo account with US$10,000 in virtual funds, without risking money.
- Secure platformProtected login and identity verification
- Multilingual supportHelp available every day
- Free demo accountUS$10,000 virtual to practice
Trading involves the risk of losing the capital invested.
