

 Português pt
 Español es
 العربية ar
 বাংলা bn
 Deutsch de
 Filipino fil
 Français fr
 हिन्दी hi
 Bahasa Indonesia id
 Italiano it
 Русский ru
 Svenska sv
 ไทย th
 Türkçe tr
 Tiếng Việt vi
 简体中文 zh
Updated:
Risk managementThe 3-5-7 Rule in Trading: What It Is and How to Apply It
 Camila NascimentoEditorial character · Risk & Behavior Desk

Quick answer
The 3-5-7 rule is a set of risk management limits: risk at most 3% of capital per trade, keep at most 5% at risk adding up all open positions, and aim for gains of at least 7% on winning trades. It doesn't pick assets or guarantee a profit; it exists so a losing streak doesn't wreck the account.
A good number of traders don't lose money by picking the wrong assets, but by risking too much on each trade and having no limit on the total exposed at once. The 3-5-7 rule organizes these limits into three easy-to-remember numbers, with no complicated spreadsheet.
In this article we explain each number and do the math in reais with a R$ 10,000 account and BOVA11's real quotes, the fund that tracks the Ibovespa, between April and October 2026.
What the 3-5-7 Rule Is
- 3%: the maximum risk per trade, that is, how much you lose if the stop is hit.
- 5%: the maximum combined risk of all trades open at the same time.
- 7%: the minimum gain targeted on winning trades, so they comfortably outweigh the losing ones.
There are variations in how the third number is described: some versions talk about 7% of capital, others about gains being at least a certain proportion bigger than the losses. The common idea is the same: the winning trade needs to be worth a lot more than the losing one costs.

How to Calculate Position Size from the 3%
The 3% limit isn't the position size; it's the maximum loss. The formula links the two:
Quantity = (capital × 0.03) ÷ (entry price − stop price)
With R$ 10,000, the maximum risk is R$ 300. The stop goes where the technical read is invalidated; here we use 2 ATR below the entry. The ATR measures the asset's average daily range over the last 14 trading days.
Real Example: The Rule Applied to BOVA11
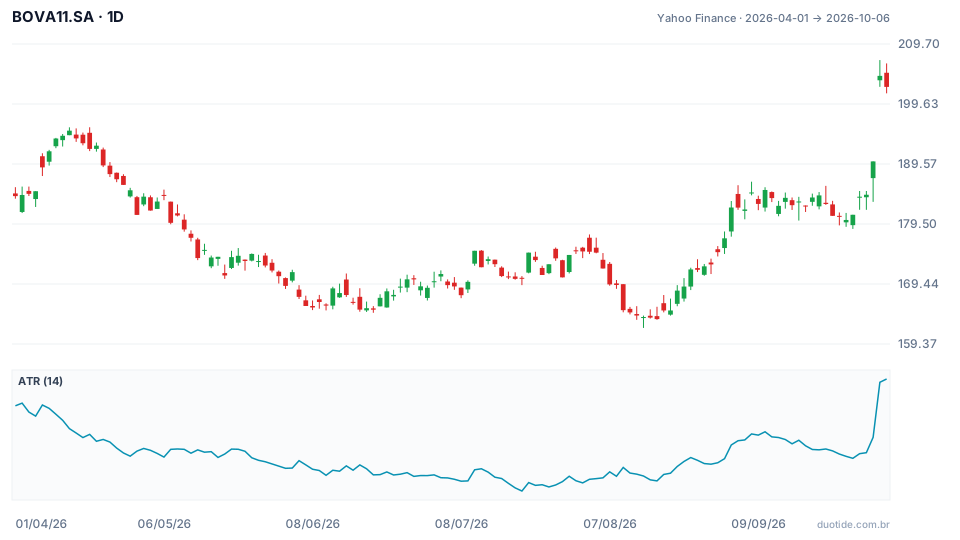
The chart shows BOVA11 from April 1 to October 6, 2026, with the 14-day ATR below. The fund went from R$ 184.18 to R$ 202.50 over the period, a 9.95% gain, with a low of R$ 162.07 on August 14 and a high of R$ 207.00 on October 5.
August: A Trade Within the Rule
- Entry: August 21, 2026, at the close of R$ 168.33, a few days after the period's low.
- That day's ATR: R$ 2.68. Stop at 2 ATR = R$ 5.37 below, at R$ 162.96.
- Quantity: 300 ÷ 5.37 = 55.9, rounded down: 55 shares, or a R$ 9,258.15 position. Actual risk: 55 × 5.37 = R$ 295.08, or 2.95% of the account.
- Target of 7% of capital: R$ 700 ÷ 55 shares = R$ 12.73 per share, target at R$ 181.06. Gain-to-risk ratio: 12.73 ÷ 5.37 = 2.37.
In the real case, the lowest low after the entry was R$ 166.49, above the stop, and the target was reached on September 2, when the high hit R$ 183.36. A gain of about R$ 700. This describes a trade that worked out; the rule exists so the ones that don't work out cost only R$ 300.
July: When the Account Can't Fit the Position
On July 21, the ATR stood at R$ 2.24, the period's lowest, with the share at R$ 170.34. By the formula, 300 ÷ 4.49 would give 66 shares, or R$ 11,242.44, more than the whole account. Without leverage, the maximum would be 58 shares, with a risk of about R$ 260. In calm periods, the real limit becomes the capital, not the 3%.
October: Volatility Doubles and the Position Shrinks
BOVA11 closed on October 2 at R$ 190.00 and opened on October 5 at R$ 203.61, a 7.2% gap between one trading day and the next. The ATR rose to R$ 4.25 on October 6. With the share at R$ 202.50, the 2 ATR stop would sit R$ 8.50 away, and the same R$ 300 risk would allow for only 35 shares, or R$ 7,087.50. The rule keeps the risk fixed and lets volatility decide the size. These examples show what happened; they don't indicate the next move.

How to Apply the 5% and the 7%
The 5% Total Exposure
With the August trade open, risking R$ 295.08, there's room left to risk at most R$ 204.92 in other positions, about 2%. Watch out for correlation: a second purchase in a large Ibovespa stock moves together with BOVA11 and, in practice, increases the same bet. Three 3% positions in assets that move together can add up to 9% of real risk.
Why 3% and Not 10%
Ten losses in a row at 3% leave the R$ 10,000 account with R$ 7,374.24, a 26.3% drop. Risking 10%, the same streak leads to R$ 3,486.78, a 65.1% drop. The first is hard, but recoverable; the second jeopardizes your ability to keep going.
The Math of the 7%
With a 7% gain on winners and a 3% loss on losers, the break-even point is winning 3 ÷ (3 + 7) = 30% of trades. With a 45% win rate, the expectancy per trade would be 0.45 × 7 − 0.55 × 3 = 1.5% of capital. Over 40 trades, 18 winners and 22 losers would add up to 126 − 66 = 60 percentage points, not counting costs and the effect of compounding.
Limitations
The rule doesn't guarantee a profit. The stop can be executed worse than planned on price gaps, like October 5's. 7%-of-capital targets can be too far away for low-volatility assets and force drawn-out trades. And 3% is still high for many profiles: some prefer 1% or 2% per trade within the same structure.
Common Mistakes with the 3-5-7 Rule
- Confusing 3% risk with 3% of the capital invested in the position.
- Respecting the 3% on each trade and forgetting to add up the open positions' risk.
- Ignoring the correlation between assets that move together.
- Rounding the quantity up and exceeding the limit.
- Moving the stop after the entry, increasing the actual risk.
- Accepting trades with a target smaller than the risk just because the signal looks good.
To practice the rule, open a demo account with the same capital you plan to use and, before each trade, calculate the quantity from the stop, add up the open positions' risk, and check the target. Log everything for a few weeks: the record shows whether you can stick to the three numbers when the market gets tough.
Practice before you risk. Open your Duotide account and test your ideas on the demo account with US$10,000 in virtual funds.
Create free accountUpdated:
Editorial character of the Duotide newsroom. Articles are written by the team with the help of artificial intelligence; prices and charts come from real market data. Writes about risk management, position sizing and the psychology behind traders' decisions.
Was this article helpful?
Be the first to rate it.
Comments
- No comments yet. Be the first to comment.
Ready to put it into practice?
Open your account and practice on the demo account with US$10,000 in virtual funds, without risking money.
- Secure platformProtected login and identity verification
- Multilingual supportHelp available every day
- Free demo accountUS$10,000 virtual to practice
Trading involves the risk of losing the capital invested.
