

 Português pt
 Español es
 العربية ar
 বাংলা bn
 Deutsch de
 Filipino fil
 Français fr
 हिन्दी hi
 Bahasa Indonesia id
 Italiano it
 Русский ru
 Svenska sv
 ไทย th
 Türkçe tr
 Tiếng Việt vi
 简体中文 zh
Updated:
MarketsWhat Is Quantitative Easing (QE) and How It Affects Markets
 Rafael AzevedoEditorial character · Markets Desk

Quick answer
Quantitative easing (QE) is when the central bank buys bonds in large volume with newly created money to push long-term rates down and stimulate the economy. Lower long-term rates push investors toward stocks and other risk assets and tend to weaken the currency. The reverse path, quantitative tightening, tends to do the opposite, as shown by the US 10-year yield, which went from 1.34% in December 2021 to 3.48% in June 2022.
When a central bank has already cut interest rates to near zero and still wants to stimulate the economy, it needs another tool. The best known is quantitative easing, or QE. It can sound like a topic far removed from chart trading, but QE decisions move rates, currencies, stocks, and gold worldwide.
To show the effect with real numbers, we used the yield on the 10-year US Treasury note (^TNX, Yahoo Finance data) between October 2021 and July 2022, precisely the period when the Federal Reserve ended pandemic-era QE and began moving in the opposite direction.
What Quantitative Easing Is
It's a policy in which the central bank buys large volumes of government bonds and, in some cases, other assets, like mortgage-backed securities. It pays for these purchases with newly created electronic reserves, increasing the amount of money in the financial system.
Cutting interest rates affects the very short-term rate. QE acts on long-term rates: by buying 5-, 10-, or 30-year bonds, the central bank pushes up the price of those bonds and drives down their yield. With bonds paying little, investors look for returns in stocks, private credit, real estate, and emerging markets.
The Fed used QE in several rounds after the 2008 crisis and again, on a much larger scale, starting in March 2020. The reverse process, where the central bank lets bonds mature without replacing them or sells them outright, is called quantitative tightening, or QT.

How QE Drives Down a Bond's Yield
A bond's price and yield move in opposite directions. A hypothetical example, just to show the math:
- A bond pays $40 a year and costs $1,000. Yield = 40 ÷ 1,000 = 4.00%.
- The central bank starts buying this bond in large volume, and the price rises to $1,050.
- The payment stays at $40. New yield = 40 ÷ 1,050 = 3.81%.
A large, steady buyer pushes the price up and the yield down. When it exits the scene, the opposite happens.
Real Example: the End of QE and the 10-Year Yield
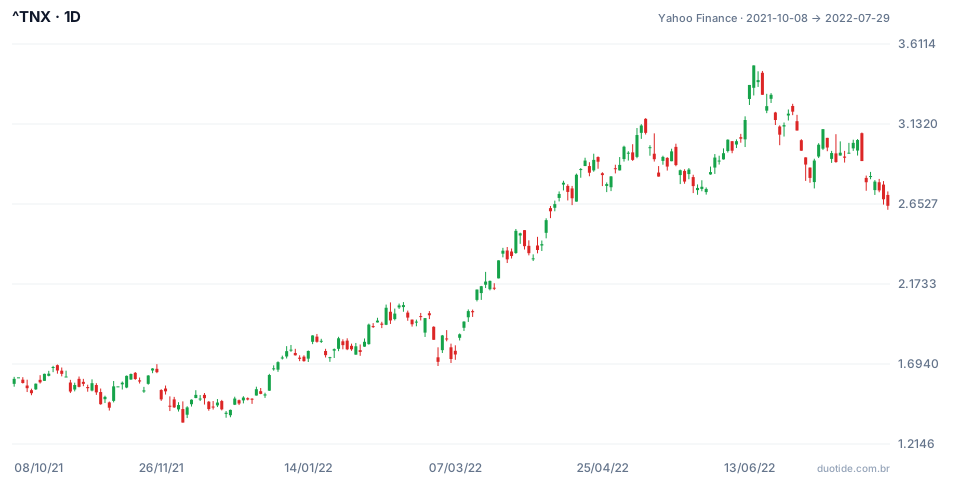
The chart shows the 10-year note's daily yield, in annual percentage terms. Three dates on the Fed's calendar help explain what happened:
November 2021: the Taper Announcement
On 11/03/2021 the Fed announced it would start slowing the pace of its bond purchases. That day the 10-year yield closed at 1.58%. The market didn't react right away: the window's low came on 12/03/2021, at 1.34%.
March 2022: Purchases End and the First Rate Hike
Net purchases ended in early March. On 03/09/2022 the yield stood at 1.95%, and on 03/16, the day of the cycle's first rate hike, it closed at 2.19%. In just over three months since December's low, the long-term rate had risen 0.85 percentage point.
June 2022: Quantitative Tightening Begins
On 06/01/2022 the Fed started shrinking its own balance sheet, QT. The yield stood at 2.93% and reached 3.48% on 06/14, the window's high, more than double December's low. Over the same period, the S&P 500 dropped 23.55% between the 01/03/2022 record (4,796.56 points) and the 06/16/2022 close (3,666.77). The Nasdaq fell 33.7% from its 11/19/2021 peak through that same 06/16. Rising long-term rates reduce the present value of future earnings, and growth stocks felt it most.
Not all of this was purely an effect of the end of QE: high inflation and rate hikes weighed in alongside it. The case shows how the two tend to move together.

How Traders Use This Information
Long-Term Rates
A QE announcement tends to drive long-term yields down; the end of QE or the start of QT tends to push them up. Watching the ^TNX helps gauge what the market is pricing in.
Currencies
More currency in circulation and lower rates tend to weaken the currency of the country running QE relative to others. The effect shows up in pairs like EUR/USD and USD/JPY, especially when two central banks are moving in opposite directions.
Stocks and Risk Assets
With bonds paying little, money migrates to stocks and other risk assets. That's why QE is usually associated with rising stock markets, and its end with corrections, as in 2022.
The Calendar
Decisions come out on known dates: the Fed, ECB, Bank of Japan, and Bank of England meetings. On these days, volatility tends to rise, and it's worth reducing position size or waiting for the initial reaction to pass.
Limitations
The market anticipates: the price often moves in the weeks before the announcement, and the reaction on the day itself is small or even contrary. QE also never happens alone; inflation, growth, and fiscal policy move alongside it. Attributing an entire move to it alone is oversimplifying.
Common Mistakes About Quantitative Easing
- Thinking QE means printing physical banknotes: the new money is electronic bank reserves.
- Assuming every QE announcement makes the stock market rise on the same day.
- Ignoring that the market anticipates decisions and may have already priced in the announcement.
- Confusing QE with rate cuts: one acts on long-term rates, the other on the benchmark rate.
- Trading in the minute of the central bank's decision without limiting position size.
- Forgetting that the examples above describe what happened, not what will happen.
To practice, mark the next Fed and ECB meetings on your calendar and track, in a demo account, how the 10-year yield, EUR/USD, and the S&P 500 behave on the day and in the following week. Note what was announced and what the price did: over time, you'll learn to separate what was already priced in from what was a surprise.
Practice before you risk. Open your Duotide account and test your ideas on the demo account with US$10,000 in virtual funds.
Create free accountUpdated:
Editorial character of the Duotide newsroom. Articles are written by the team with the help of artificial intelligence; prices and charts come from real market data. Follows the news that moves prices — rates, stock markets, companies and commodities — explained without jargon.
Was this article helpful?
Be the first to rate it.
Comments
- No comments yet. Be the first to comment.
Ready to put it into practice?
Open your account and practice on the demo account with US$10,000 in virtual funds, without risking money.
- Secure platformProtected login and identity verification
- Multilingual supportHelp available every day
- Free demo accountUS$10,000 virtual to practice
Trading involves the risk of losing the capital invested.
