

 Português pt
 Español es
 العربية ar
 বাংলা bn
 Deutsch de
 Filipino fil
 Français fr
 हिन्दी hi
 Bahasa Indonesia id
 Italiano it
 Русский ru
 Svenska sv
 ไทย th
 Türkçe tr
 Tiếng Việt vi
 简体中文 zh
Updated:
Risk managementWhat Is Volatility in the Financial Market and How to Measure It
 Camila NascimentoEditorial character · Risk & Behavior Desk

Quick answer
Volatility is the measure of how much an asset's price swings over a period. The most common way to measure it is the standard deviation of daily returns, annualized; the ATR shows the same idea in dollars per day. Volatility doesn't indicate direction, but it sets the size of the stop and the position: the more volatile the asset, the smaller the quantity needs to be to keep the same risk.
When someone says the market is choppy or that an asset is too risky, they're talking about volatility. It's one of the most used concepts in the financial market and one of the ones that most affect a trader's result, because it sets the size of the stop, the size of the position, and even how much a trader can emotionally stand to hold a trade.
In this guide, instead of illustrative numbers, we use real daily quotes between April and October 2026 to compare the volatility of stocks, indexes, currencies, commodities, and bitcoin.
What Volatility Is
Volatility is the measure of how much an asset's price changes over an interval of time. A very volatile asset rises and falls several percentage points in a few days; a less volatile one moves slowly.
Volatility doesn't indicate direction. An asset can be very volatile while rising, falling, or trading sideways. What it measures is the typical size of the swings, and therefore the uncertainty about where the price will be a few days from now.
Historical and Implied Volatility
- Historical: calculated from prices that have already happened. It's objective and easy to reproduce.
- Implied: extracted from the asset's option prices and reflects how much the market expects it to swing in the future. The VIX index, for example, is the implied volatility of the S&P 500's options.

How to Calculate Historical Volatility
The most used calculation has three steps:
- Calculate each day's return (today's close ÷ yesterday's close − 1; professionals use the logarithm of that ratio).
- Calculate the standard deviation of those returns. That's the typical size of the daily move.
- Annualize by multiplying by the square root of the number of trading days in the year: √252 ≈ 15.87 for stocks and currencies, √365 for cryptocurrencies, which trade every day.
Example With Real Data
With daily closes from 04/01/2026 to 10/07/2026 (131 moves for US stocks), Tesla's daily standard deviation was 3.143% and the S&P 500's, 0.77%. Annualizing:
- Tesla: 3.143% × 15.87 = 49.9% a year
- S&P 500: 0.77% × 15.87 = 12.2% a year
Tesla swung about four times more than the index. In practice, this showed up like this: the stock had 38 sessions with a move bigger than 3% over the period; the S&P 500, none.
Over the same interval, the annualized volatility of other assets was: WTI crude 61.6%, Nvidia 38.0%, bitcoin 37.4% (365-day basis), Apple 27.2%, gold 23.2%, the Ibovespa 19.3%, and EUR/USD 5.0%. That's why the same 2% stop is tight on one asset and wide on another.
Real Example: Tesla's Volatility in 2026
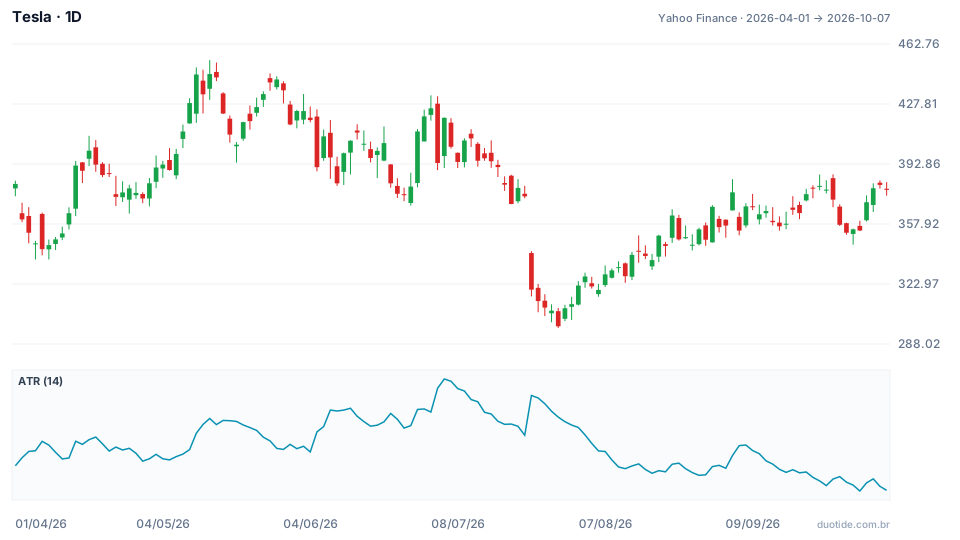
The panel below shows the 14-period ATR, which measures the average daily range in dollars (accounting for high, low, and gaps). It's the most practical way to see volatility on the chart.
July: Volatility at Its Peak
On 07/06/2026 the ATR reached $20.32, with the stock at $419.77: an average daily swing of 4.8%. A few weeks later, on 07/23, Tesla opened at $341.00, against $374.01 at the previous close, and closed at $319.69, down 14.52% in a single session. The period's low came on 07/29, at $297.38.
October: Volatility on the Decline
On 10/01 the ATR stood at $11.82, with the stock at $354.11, or 3.3% a day. Same asset, almost half of July's daily swing. The price barely changed over the whole period (from $381.26 to $377.81, down 0.9%), but the path included a high of $453.40 on 05/13 and a low of $297.38. A small net change doesn't mean low volatility.
The Effect on Position Size
Suppose a $10,000 account, 1% risk ($100) per trade, and a stop at 2 ATRs:
- On 07/06: a stop of 2 × 20.32 = $40.64 → 100 ÷ 40.64 = 2.46 → 2 shares
- On 10/01: a stop of 2 × 11.82 = $23.64 → 100 ÷ 23.64 = 4.23 → 4 shares
The dollar risk is the same; what changes is the quantity. When volatility doubles, the position is cut in half.

How to Use Volatility
To Calibrate the Stop
A stop smaller than the asset's normal swing gets hit by noise. Using multiples of the ATR (1.5 to 3, depending on the timeframe) adapts the stop to the market's current moment.
To Size the Position
Calculate the quantity from the stop, as in the example. This keeps the risk per trade constant between calm and choppy assets.
To Adjust Expectations
With 5% annual volatility, EUR/USD rarely moves more than 1% in a day. With 50%, a stock like Tesla can move that much several times in a week. Knowing this avoids surprises and panicked decisions.
Limitations
Historical volatility looks backward: July's didn't warn about the 07/23 session before it happened. It also shifts regimes, and calm periods tend to be followed by choppy ones. No volatility measure says which way the price will go.
Common Mistakes About Volatility
- Confusing volatility with a downtrend: it measures the size of the swings, not the direction.
- Using the same percentage stop on every asset, without looking at how much each one swings.
- Keeping the same position size when volatility doubles.
- Assuming an asset that ended the half-year flat was calm.
- Assuming today's low volatility will continue: the examples above describe the past, not the future.
In a demo account, add the 14-period ATR to the charts of the assets you follow and note, every week, the value in dollars and as a percentage of the price. Calculate each simulated position's size from it and log the result. In a short time you'll have your own sense of how much each asset typically moves.
Practice before you risk. Open your Duotide account and test your ideas on the demo account with US$10,000 in virtual funds.
Create free accountUpdated:
Editorial character of the Duotide newsroom. Articles are written by the team with the help of artificial intelligence; prices and charts come from real market data. Writes about risk management, position sizing and the psychology behind traders' decisions.
Was this article helpful?
Be the first to rate it.
Comments
- No comments yet. Be the first to comment.
Ready to put it into practice?
Open your account and practice on the demo account with US$10,000 in virtual funds, without risking money.
- Secure platformProtected login and identity verification
- Multilingual supportHelp available every day
- Free demo accountUS$10,000 virtual to practice
Trading involves the risk of losing the capital invested.
