

 Português pt
 Español es
 العربية ar
 বাংলা bn
 Deutsch de
 Filipino fil
 Français fr
 हिन्दी hi
 Bahasa Indonesia id
 Italiano it
 Русский ru
 Svenska sv
 ไทย th
 Türkçe tr
 Tiếng Việt vi
 简体中文 zh
Updated:
ETFs & indicesIVV vs. SPY vs. VOO: What's the Difference Between S&P 500 ETFs
 Rafael AzevedoEditorial character · Markets Desk

Quick answer
SPY, IVV, and VOO track the same index, the S&P 500, which is why their performance is nearly identical. The difference lies in the fee (0.0945% a year for SPY versus 0.03% for IVV and VOO), the legal structure, and liquidity, where SPY is far ahead. In general, SPY is used more by short-term traders, and IVV or VOO by those investing for years.
SPY, IVV, and VOO are the three largest ETFs tied to the S&P 500, and they come up in practically every conversation about investing in the US market. Since all three track the same index, a lot of people conclude it doesn't matter which one you pick. In practice, they differ on three points that matter: annual cost, legal structure, and liquidity.
In this guide we compare the three point by point and use real daily 2026 prices (Yahoo Finance) to show how closely they moved together and where the differences show up.
What SPY, IVV, and VOO have in common
All three replicate the S&P 500, an index of roughly 500 of the largest publicly traded companies in the United States, weighted by market value. Each fund's portfolio holds the same stocks, in roughly the same proportions. Because of that, the performance difference between them doesn't come from asset selection, but from each fund's structure and what it charges.
Another consequence: each share's price is different (SPY and IVV near $780, VOO near $714 on October 7, 2026), but that says nothing about which one is more expensive. What matters is the percentage change, and it's nearly identical across the three.

The differences between the three ETFs
SPY: the pioneer and the most liquid
SPY, from State Street, launched in January 1993 and is considered the first ETF listed in the United States. It's a unit investment trust, an older structure that doesn't allow dividends to be reinvested inside the fund or the portfolio's shares to be lent out for extra income. Its expense ratio is 0.0945% a year.
Its strong point is liquidity. Looking at the last 60 sessions through October 7, 2026, SPY traded an average of about 44 million shares a day, around $34 billion daily. That means a minimal bid-ask spread and a very deep options market.
IVV and VOO: a modern structure and a lower fee
IVV, from iShares (BlackRock), dates from 2000; VOO, from Vanguard, from 2010. Both are open-end funds, a structure that allows dividends to be reinvested internally between distributions and shares to be lent out. Both charge 0.03% a year, less than a third of SPY's fee.
Liquidity is lower, but far from being a problem for an individual investor: over the same 60 sessions, IVV traded an average of 6.6 million shares a day and VOO 7.2 million, around $5.1 billion and $5.2 billion daily, respectively.
- SPY: fee of 0.0945% a year, higher liquidity, and a more developed options market.
- IVV: fee of 0.03% a year, open-end fund structure, good liquidity.
- VOO: fee of 0.03% a year, open-end fund structure, good liquidity.
How to calculate the fee's impact over the long run
The 0.0645 percentage-point difference per year seems irrelevant, and over one year it really is: on $10,000, SPY charges about $9.45 and IVV or VOO about $3.00. The effect shows up with compound interest. A hypothetical example, with a gross return of 8% a year over 20 years:
- With a 0.0945% fee: $10,000 × (1.08 − 0.000945) to the power of 20 ≈ $45,800.65
- With a 0.03% fee: $10,000 × (1.08 − 0.0003) to the power of 20 ≈ $46,351.31
- Final difference: $550.66, or about 1.2% of the final balance.
The 8% return is just an assumption for the calculation, not a forecast. The point is that the larger the amount and the time frame, the more the fee weighs.

Real example: SPY, IVV, and VOO in 2026
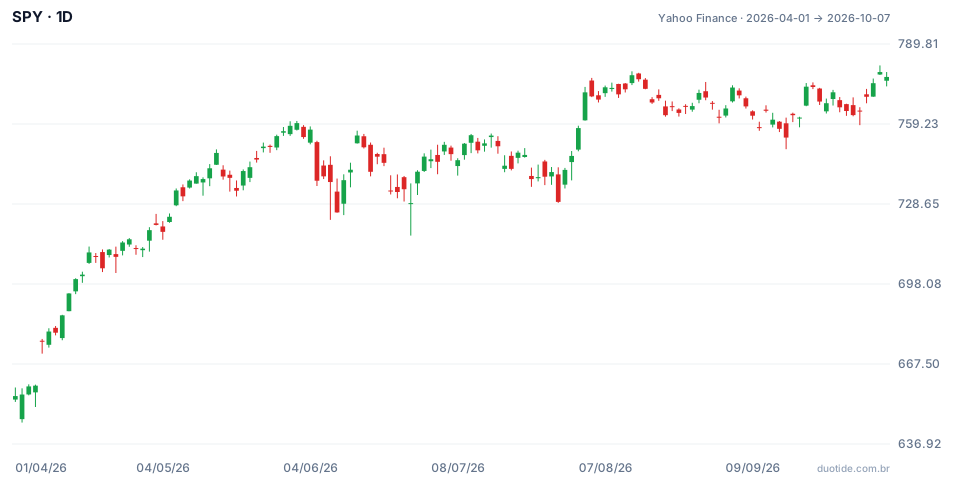
The chart shows SPY from April 1, 2026 to October 7, 2026. Over that period it went from $655.24 to $777.22, up 18.62%, with a low of $645.11 on April 2 and a high of $781.62 on October 6. Comparing it with the other two on the same dates:
Same window, nearly identical results
Between April 1 and October 7, 2026, IVV went from $658.06 to $780.58 (+18.62%) and VOO from $602.30 to $714.34 (+18.60%). The S&P 500 index itself rose 18.65% over the same stretch. The difference between the three ETFs came down to hundredths of a percentage point.
Year to date and over 12 months
From January 2 to October 7, 2026, the price change was 13.77% for SPY, 13.76% for IVV, and 13.69% for VOO. Over 12 months (October 7, 2025 to October 7, 2026), 16.16%, 16.09%, and 16.12%. These figures account only for price, not dividends, and the small differences come largely from the dates each fund pays out distributions (on the ex-dividend date, the share price drops by the amount paid). Over short periods, the lower fee barely shows up; it's noticeable over decades.
How to use this comparison to choose
For short-term traders
Anyone entering and exiting positions frequently, or trading options, tends to prefer SPY. The minimal spread and the depth of the options market matter more than the annual fee, which is negligible in a trade lasting a few days.
For long-term investors
For buy-and-hold investors, IVV and VOO tend to make more sense because of the lower fee and the structure that reinvests dividends between distributions. Between the two, the practical difference is small; the choice often comes down to the broker and brokerage costs.
Taxation for Brazilian residents
All three are domiciled in the United States: dividends are withheld at the source there, and capital gains are taxed in Brazil, under the rules of Brazil's federal tax authority (Receita Federal). There's also the matter of US estate taxes for holdings above the exemption threshold for foreigners. Check the rules in force before deciding, since they change.
Limitations
Picking the right ETF doesn't protect against the index falling. All three drop together when the S&P 500 drops, and foreign investors remain exposed to currency swings on top of that. The comparison above deals with cost and structure, not risk.
Common mistakes when comparing S&P 500 ETFs
- Thinking the cheaper share price (VOO, in this case) means a cheaper investment. The share price has no relation to cost.
- Comparing the three funds' returns over a few months and concluding one is better: differences over that span are noise.
- Ignoring the fee on decades-long investments or, at the other extreme, switching funds and paying tax on the gain just to save a few hundredths of a point.
- Forgetting exchange-rate swings and Brazilian taxation when calculating the return.
- Treating the numbers above as a promise: they describe what happened in 2026, not what will happen.
Before investing, it's worth opening the charts of all three ETFs in a demo account, placing them side by side, and watching for a few weeks how they move, including dividend days. Note what you observe: your own log helps more than any ready-made comparison.
Practice before you risk. Open your Duotide account and test your ideas on the demo account with US$10,000 in virtual funds.
Create free accountUpdated:
Editorial character of the Duotide newsroom. Articles are written by the team with the help of artificial intelligence; prices and charts come from real market data. Follows the news that moves prices — rates, stock markets, companies and commodities — explained without jargon.
Was this article helpful?
Be the first to rate it.
Comments
- No comments yet. Be the first to comment.
Ready to put it into practice?
Open your account and practice on the demo account with US$10,000 in virtual funds, without risking money.
- Secure platformProtected login and identity verification
- Multilingual supportHelp available every day
- Free demo accountUS$10,000 virtual to practice
Trading involves the risk of losing the capital invested.
