

 Português pt
 Español es
 العربية ar
 বাংলা bn
 Deutsch de
 Filipino fil
 Français fr
 हिन्दी hi
 Bahasa Indonesia id
 Italiano it
 Русский ru
 Svenska sv
 ไทย th
 Türkçe tr
 Tiếng Việt vi
 简体中文 zh
Updated:
OptionsOptions Greeks for Beginners: Delta, Gamma, Theta, and Vega
 Naomi TanakaEditorial character · Analysis Desk

Quick answer
The Greeks measure how an option's price reacts to each factor: delta measures the reaction to the asset's price, gamma measures how much delta changes, theta measures the loss of value over time, and vega measures the reaction to implied volatility. Together, they show the position's risk before you enter.
Anyone starting to study options quickly runs into four Greek letters: delta, gamma, theta, and vega. They're sensitivity measures: they show how an option's price reacts to the underlying asset's movement, to the passage of time, and to a change in volatility. Understanding them helps you evaluate a trade before entering, instead of figuring out afterward why the contract moved in an unexpected way.
In this guide we apply delta and gamma to two real moves in Alphabet (GOOGL) stock in 2026. The stock prices are real; the values for the Greeks and the premiums are hypothetical, chosen to illustrate the math, because they depend on the specific contract.
What the options Greeks are
Delta: how much the option moves with the asset
Delta measures how much the option's price tends to change for every $1.00 move in the asset, with other factors held constant. A call with a delta of 0.60 tends to rise about $0.60 when the stock rises $1.00. Calls have a delta between 0 and 1; puts, between −1 and 0. The deeper in the money, the closer delta gets to 1 or −1; the farther out, the closer to zero.
Gamma: the speed at which delta changes
Gamma measures how much delta changes for every $1.00 move in the asset. It's highest for options near the strike price and close to expiration. High gamma means the position's risk profile changes fast.
Theta: the cost of time
Theta measures how much value the option tends to lose per day just from the passage of time. A call with a theta of −0.25 loses about $0.25 a day if nothing else changes; over 10 days, $2.50. For option buyers, theta works against them; for sellers, in their favor. The decay speeds up near expiration.
Vega: sensitivity to volatility
Vega measures how much the option's price changes for every percentage point of change in implied volatility. Ahead of events like company earnings, implied volatility tends to rise and make options more expensive; afterward, it usually drops sharply, which can reduce the option's value even if the asset moved in the expected direction.
Rho: the interest-rate Greek
Rho measures sensitivity to interest rates. It matters little in short trades; it becomes relevant in long-dated options and during periods of fast-changing interest rates.

How to calculate the effect of delta and gamma
For a move of ΔS in the asset, the approximate change in the option is:
- Delta only: change ≈ delta × ΔS
- With delta and gamma: change ≈ delta × ΔS + ½ × gamma × ΔS²
- New delta ≈ delta + gamma × ΔS
The approximation works best for moderate moves and ignores theta and vega, which also change over the same period.
Real example: two Alphabet moves in 2026
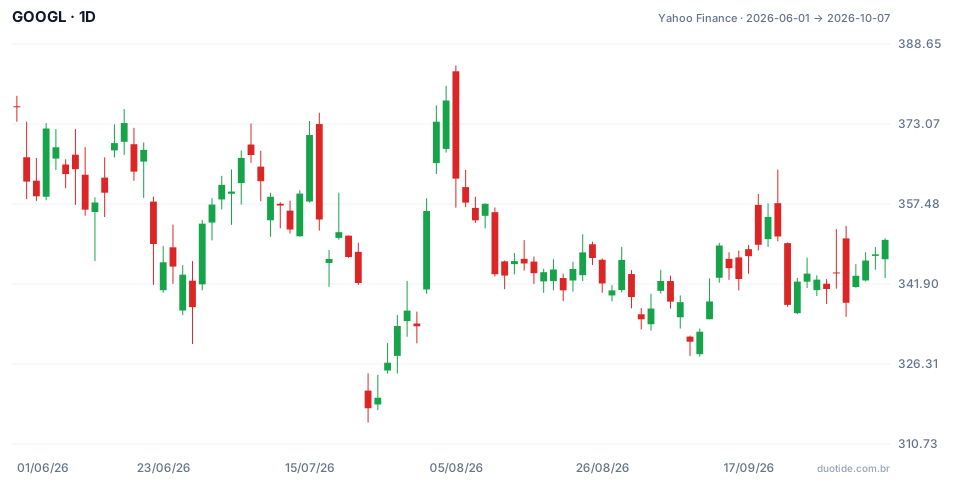
The chart shows GOOGL's daily candles from June 1, 2026, to October 7, 2026. The stock started the period at $376.37, had a low of $314.90 on July 23, a high of $384.48 on August 5, and closed October 7 at $350.50.
July 23: a 7.1% drop in one day
The stock closed July 22 at $342.09 and July 23 at $317.69, a drop of $24.40. Imagine a hypothetical call bought on July 22 for $15.00, with a delta of 0.50 and a gamma of 0.01.
- Delta only: 0.50 × (−24.40) = −$12.20
- Gamma adjustment: ½ × 0.01 × 24.40² = +$2.98
- Estimate: −12.20 + 2.98 = −$9.22, a premium of about $5.78
- New delta: 0.50 − 0.01 × 24.40 = 0.26
The stock fell 7.1%; the hypothetical call would have lost about 61%. Gamma cushioned the loss, since delta kept shrinking as the stock fell, but the option's leverage was still plain to see.
July 31: a 6.7% rise in one day
The stock closed July 30 at $333.66 and July 31 at $356.13, a rise of $22.47. With another hypothetical call at $12.00, delta of 0.50, and gamma of 0.01:
- Delta only: 0.50 × 22.47 = $11.24
- Gamma adjustment: ½ × 0.01 × 22.47² = $2.52
- Estimate: +$13.76, a rise of about 115% in the premium
- New delta: 0.50 + 0.01 × 22.47 = 0.72
Here gamma worked in favor of whoever bought the call: delta grew during the rise. For whoever sold that call, the same gamma increased the loss. The examples describe moves that happened; they don't indicate what the stock will do afterward.

How to use the Greeks
Before buying an option
Look at theta: it tells you how much time costs per day. If you expect a slow move, a high-theta option can lose value before the asset gets where you expect.
Before selling an option
Look at gamma, especially near expiration. High gamma can turn a calm position into a very risky one within a few sessions, as the July 31 rally showed.
Before events
Look at vega and implied volatility. Buying expensive options ahead of an earnings report and watching volatility drop afterward is one of the most common ways to lose money while getting the direction right.
Limitations
The Greeks are model estimates and change constantly. The delta-and-gamma math is a local approximation; in large moves or near expiration, the option's actual price can drift well away from it.
Common mistakes with the Greeks
- Looking only at delta and ignoring the effect of time and volatility.
- Buying far-out-of-the-money, low-delta options thinking they're cheap.
- Selling options naked near expiration without considering gamma.
- Getting the direction right and still losing because implied volatility dropped.
- Forgetting that buying options can mean losing the entire premium paid.
To practice, pick an option on a demo account, note the delta, gamma, theta, and vega on entry day, and compare, day by day, the estimated change with the premium's actual change. Logging a few full series fixes the fundamentals better than any reading.
Practice before you risk. Open your Duotide account and test your ideas on the demo account with US$10,000 in virtual funds.
Create free accountUpdated:
Editorial character of the Duotide newsroom. Articles are written by the team with the help of artificial intelligence; prices and charts come from real market data. Explains charts, indicators and trading strategies: how they work, where they fail and how to test them first.
Was this article helpful?
Be the first to rate it.
Comments
- No comments yet. Be the first to comment.
Ready to put it into practice?
Open your account and practice on the demo account with US$10,000 in virtual funds, without risking money.
- Secure platformProtected login and identity verification
- Multilingual supportHelp available every day
- Free demo accountUS$10,000 virtual to practice
Trading involves the risk of losing the capital invested.
