

 Português pt
 Español es
 العربية ar
 বাংলা bn
 Deutsch de
 Filipino fil
 Français fr
 हिन्दी hi
 Bahasa Indonesia id
 Italiano it
 Русский ru
 Svenska sv
 ไทย th
 Türkçe tr
 Tiếng Việt vi
 简体中文 zh
Updated:
IndicatorsVortex Indicator: How to Calculate, Configure, and Use VI+/VI-
 Naomi TanakaEditorial character · Analysis Desk

Quick answer
The Vortex indicator shows two lines, VI+ (upward movement) and VI- (downward movement), calculated from the highs, lows, and true range of the last 14 periods. When VI+ crosses above VI-, buyers have taken control; when VI- stays on top, sellers dominate. The crossover only carries weight when the gap between the lines widens over the following days; in a sideways market, the lines cross back and forth constantly.
The Vortex indicator was introduced by Etienne Botes and Douglas Siepman in 2010, inspired by Austrian inventor Viktor Schauberger's observations on the way water moves in whirlpools. The analogy is curious, but the indicator itself is simple: two lines that show which side, buyers or sellers, is pushing the price harder. In this guide we use real daily gold prices (the US futures contract, Yahoo Finance data) from March to October 2026 to show the calculation and what the indicator actually signaled.
Since the Vortex isn't drawn directly on the chart below, we calculated both lines from the same candles and point out the crossover dates in the text. You can reproduce all of it on any platform that has the indicator.
What the Vortex indicator is
The Vortex is a trend indicator made up of two lines. VI+ measures the upward move: the distance between today's high and yesterday's low. VI- measures the downward move: the distance between today's low and yesterday's high. When today's high sits well above yesterday's low, buyers have advanced; when today's low sits well below yesterday's high, sellers have dominated.
Both measures are summed over a period (14 by default) and divided by the sum of the true range (the same one used in the ATR) over the same period. This normalizes the result: the lines oscillate around 1, and what matters is which one is on top and the distance between them.

How to calculate the Vortex
- VM+ = |today's high − yesterday's low|
- VM- = |today's low − yesterday's high|
- TR (true range) = the largest of: today's high − low; |today's high − yesterday's close|; |today's low − yesterday's close|
- VI+ = sum of VM+ over 14 periods ÷ sum of TR over 14 periods
- VI- = sum of VM- over 14 periods ÷ sum of TR over 14 periods
Example with real gold data
On August 24, 2026, gold had a high of $4,738.50 and a low of $4,651.80. In the previous session, August 21, the high was $4,690.40, the low $4,565.50, and the close $4,680.60.
- Day's VM+ = 4,738.50 − 4,565.50 = 173.00
- Day's VM- = |4,651.80 − 4,690.40| = 38.60
- Day's TR = the largest of 86.70, 57.90, and 28.80 = 86.70
Adding up the 14 sessions from August 5 to August 24, we get VM+ = 2,107.20, VM- = 978.90, and TR = 1,553.60. So VI+ = 2,107.20 ÷ 1,553.60 = 1.356 and VI- = 978.90 ÷ 1,553.60 = 0.630. That was the biggest lead VI+ held over VI- in the entire period analyzed, with gold closing at $4,697.80. Notice that VI+ went above 1: during the strong rally, the sum of the upward distances exceeded the sum of the ranges.
Real example: the Vortex on gold in 2026
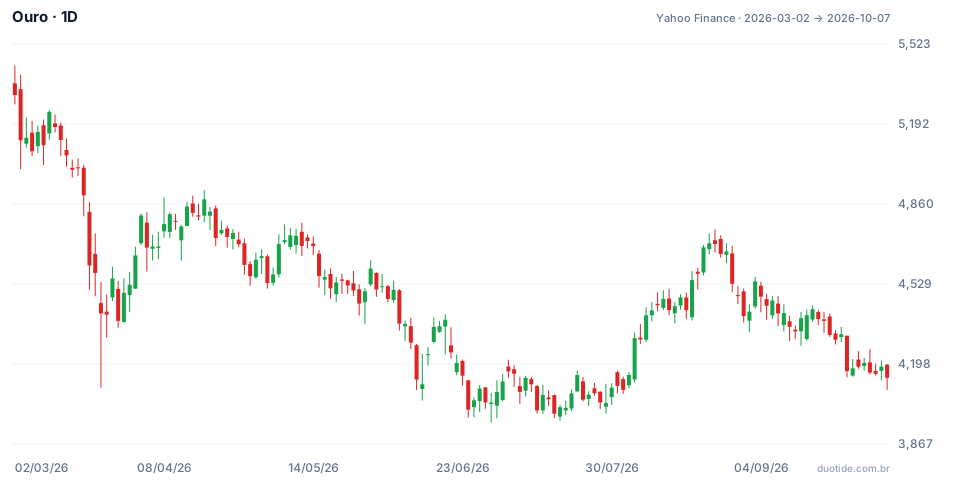
Gold opened the window at $5,311.60 on March 2 and ended October 7 at $4,140.70, a drop of 22.04%, with a low of $3,955.40 on June 30. Three stretches show well what the Vortex does and what it doesn't do.
March: VI- crossed above at the start of the drop
On March 13, VI- moved above VI+ (1.029 versus 0.919) with gold at $5,061.70. Ten sessions later, the price was at $4,492.50, 11.2% lower. The gap between the lines widened quickly: on March 23, VI- reached 1.288 and VI+ fell to 0.602, the biggest selling lead of the period, with gold at $4,407.30. A crossover followed by a widening gap between the lines is the classic reading of a confirmed trend.
July: four crossovers in seven sessions
Between July 15 and July 23, the lines crossed four times (on the 15th, 17th, 21st, and 23rd), with gold stuck between $4,018.80 and $4,076.40 at the close on those days. On July 15, for example, VI+ stayed on top by a difference of just 0.003 (1.012 versus 1.009). Anyone trading every crossover would have entered and exited four times without catching any real move. That's the Vortex's typical behavior in a sideways market.
Late July to August: the turn that worked
On July 31, VI+ crossed above (1.059 versus 0.940), this time with a much wider gap than the July crossovers. Gold was at $4,107.00 and, ten sessions later, at $4,437.30, up 8.0%. The gap between the lines kept widening until August 24, the day of the calculation above. After that, the strength faded: on September 8, VI- moved back on top with gold at $4,439.00, and on October 7 the price closed at $4,140.70 (6.7% lower), with VI- at 1.188 and VI+ at 0.817.

How to use the Vortex
Settings
The default period is 14 and works well on the daily chart. Shorter periods (7 or 10) make the lines jumpier and multiply the crossovers; longer periods (21 or 28) filter out noise but signal later. Some platforms add reference lines at 1.1 and 0.9; they help show when one line is clearly dominant, but the core reading is still the relationship between VI+ and VI-.
The line crossover
VI+ crossing above VI- suggests buying pressure has taken over; the opposite suggests sellers are in control. Treat the crossover as an alert, not an order: the July example shows that crossovers with a minimal difference between the lines are worth little.
The distance between the lines
The more the lines pull apart after the crossover, the stronger the trend. A practical filter is to wait for the difference to pass a minimum value (0.10, for example) or to wait for two or three closes with the same line on top before considering the signal. In March and in August, the difference passed 0.10 within a few days; in July, it didn't.
Combining with other indicators
The ADX helps tell whether a trend exists: a low ADX with frequent Vortex crossovers is a sign of a sideways market. Support, resistance, and the 200-period moving average provide the context the Vortex lacks.
Limitations
The Vortex is calculated only from past prices, so it always confirms the trend after it has already begun. In sideways markets it generates false signals one after another, and in assets with lots of gaps (stocks on earnings day, for example) the true range can distort the reading of a single session.
Common mistakes when using the Vortex
- Trading every crossover, including ones that happen with a minimal difference between the lines.
- Using the Vortex without checking whether the market is trending or moving sideways.
- Switching the period to 5 or 7 without testing: the number of false signals rises sharply.
- Forgetting the stop: a confirmed crossover can still fail, as the July signals showed.
- Thinking the past guarantees the future: the examples above describe what happened with gold in 2026, not what will happen.
To practice without risking money, open the gold chart or whichever asset you follow in a demo account, add the 14-period Vortex, and note, over a few weeks, the date of each crossover, the difference between the lines on that day, and what the price did over the following ten sessions. This log quickly shows which filter works for you.
Practice before you risk. Open your Duotide account and test your ideas on the demo account with US$10,000 in virtual funds.
Create free accountUpdated:
Editorial character of the Duotide newsroom. Articles are written by the team with the help of artificial intelligence; prices and charts come from real market data. Explains charts, indicators and trading strategies: how they work, where they fail and how to test them first.
Was this article helpful?
Be the first to rate it.
Comments
- No comments yet. Be the first to comment.
Ready to put it into practice?
Open your account and practice on the demo account with US$10,000 in virtual funds, without risking money.
- Secure platformProtected login and identity verification
- Multilingual supportHelp available every day
- Free demo accountUS$10,000 virtual to practice
Trading involves the risk of losing the capital invested.
