

 Português pt
 Español es
 العربية ar
 বাংলা bn
 Deutsch de
 Filipino fil
 Français fr
 हिन्दी hi
 Bahasa Indonesia id
 Italiano it
 Русский ru
 Svenska sv
 ไทย th
 Türkçe tr
 Tiếng Việt vi
 简体中文 zh
Updated:
Risk managementMathematical Expectancy in Trading: Does Your Strategy Have an Edge?
 Camila NascimentoEditorial character · Risk & Behavior Desk

Quick answer
Mathematical expectancy is the average result per trade: (win rate × average gain) − (loss rate × average loss). If it's positive after costs, the strategy had an edge in the sample analyzed; if it's negative, it loses money in the long run even with a high win rate. A strategy that wins 45% of the time can still be profitable, as long as the average gain is much larger than the average loss.
A strategy can win most of its trades and still drain the account little by little. The opposite is also true: it's possible to lose on more than half the entries and still close the month in profit. Win rate alone doesn't say whether a strategy has an edge. The one that answers that question is mathematical expectancy, also called expectancy.
What mathematical expectancy is
Expectancy shows how much a strategy gained or lost, on average, per trade, taking into account both the frequency and the size of the gains and losses at the same time. A positive number is evidence of an edge within the observed sample, not a guarantee of future profit.

How to calculate mathematical expectancy
- Expectancy = (win rate × average gain) − (loss rate × average loss)
- Net expectancy = (sum of gains − sum of losses − costs) ÷ number of trades
- In multiples of R = expectancy ÷ average planned risk per trade
Worked example in reais
Imagine a log of 40 trades from the same setup, all with a planned risk of R$ 100: 18 winners with an average gain of R$ 150 and 22 losers with an average loss of R$ 80.
- Total gain: 18 × R$ 150 = R$ 2,700
- Total loss: 22 × R$ 80 = R$ 1,760
- Result: R$ 2,700 − R$ 1,760 = R$ 940
- Expectancy: R$ 940 ÷ 40 = R$ 23.50 per trade, or +0.235R
- Profit factor: 2,700 ÷ 1,760 = 1.53
The win rate is 45%, below half, and the expectancy is still positive, because the average gain is almost double the average loss.
A negative case
Now 50 trades: 21 winners with an average gain of R$ 90 and 29 losers with an average loss of R$ 75. Gains of R$ 1,890, losses of R$ 2,175, a result of −R$ 285, and an expectancy of −R$ 5.70 per trade. With a 42% win rate, the relationship between gain and loss wasn't enough.
Real example: moving average crossover on the Ibovespa in 2026
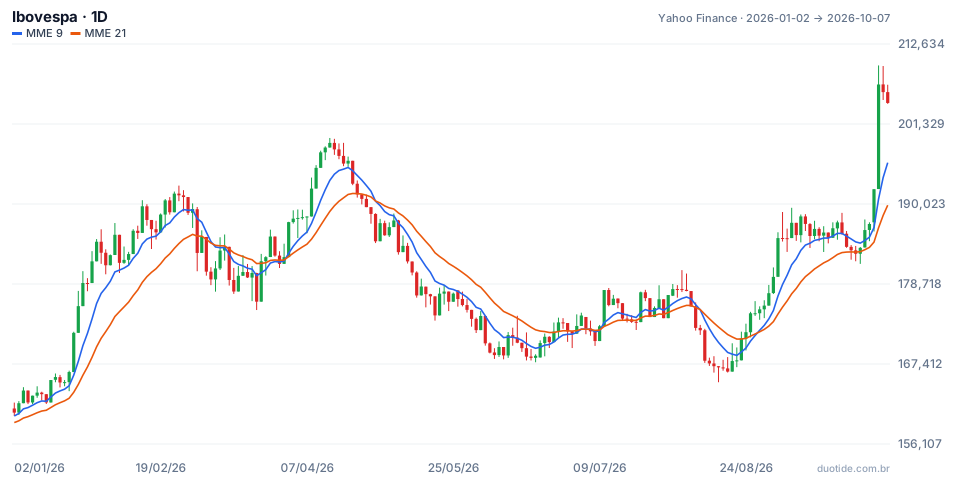
To see the math with real data, we tested a simple rule on the Ibovespa's daily quotes (from Yahoo Finance): buy at the close of the day the 9-period exponential moving average crosses above the 21-period one, and sell at the close of the day it crosses below. Between January and October 7, 2026, there were four entries:
- Buy on March 31 at 187,462 points, sell on April 29 at 184,750: −2,712 points (−1.45%)
- Buy on July 3 at 174,266, sell on July 7 at 172,021: −2,245 points (−1.29%)
- Buy on July 10 at 177,866, sell on August 10 at 172,180: −5,686 points (−3.20%)
- Buy on August 27 at 175,135, still open on October 7 at 204,302: +29,167 points (+16.65%)
The math:
- Win rate: 1 in 4 = 25%
- Average gain: 29,167 points; average loss: (2,712 + 2,245 + 5,686) ÷ 3 = 3,547.67 points
- Expectancy: 0.25 × 29,167 − 0.75 × 3,547.67 = +4,631 points per trade
- As a percentage: (16.65 − 1.45 − 1.29 − 3.20) ÷ 4 = +2.68% per trade
It looks great, but the sample tells a different story. The last trade is still open, so the gain isn't realized yet. And if it's removed, the expectancy turns into −3,547.67 points per trade: the entire result depends on a single entry. It's also worth comparing against a simple benchmark: over the same period, the Ibovespa itself rose 27.26%, from 160,539 points on January 2 to 204,302 on October 7, while the rule stayed out of the market most of the time. Four trades don't support any conclusion; the example is here to show the math and the robustness test, not to recommend the rule.

How to use expectancy day to day
Log every trade
Without a log, there's no expectancy. Note the entry, exit, planned risk, result, and costs of every trade from the same setup, including the ones that went wrong and you'd rather forget.
Deduct the real costs
Brokerage fees, exchange fees, spread, and the cost of holding positions reduce the expectancy. A strategy with a gross expectancy of R$ 6 per trade turns negative with R$ 7 of average costs. Use the costs actually charged, not an optimistic estimate.
Test the robustness
Remove the single largest winning trade and recalculate, as in the Ibovespa example. If the expectancy turns negative, the result depends too much on one outlier.
Have a large enough sample
Fewer than 30 trades is too little for any conclusion. Between 30 and 100, the number already gives a first estimate, but it still changes quite a bit with a few extreme results. Above 100 or 200, it becomes more informative, though never proof that the edge will continue.
Limitations
Expectancy summarizes the past. Markets change regime, and a rule that worked in a trend can fail in the sideways stretch that follows. It also says nothing about the losing streak the account needs to survive along the way.
Common mistakes when calculating mathematical expectancy
- Judging the strategy only by its win rate.
- Calculating without deducting costs.
- Drawing conclusions from samples with fewer than 30 trades.
- Counting open trades as if they were a realized result.
- Mixing different setups into the same count.
- Increasing position size right after a good streak, before testing the robustness.
To practice without risking money, pick a setup, trade it on a demo account, and log every trade in a spreadsheet with risk, result, and costs. Every 30 trades, recalculate the expectancy and the test without the largest winner. The Ibovespa numbers above describe what happened, not what will happen; your own log is what will tell you whether your setup has an edge.
Practice before you risk. Open your Duotide account and test your ideas on the demo account with US$10,000 in virtual funds.
Create free accountUpdated:
Editorial character of the Duotide newsroom. Articles are written by the team with the help of artificial intelligence; prices and charts come from real market data. Writes about risk management, position sizing and the psychology behind traders' decisions.
Was this article helpful?
Be the first to rate it.
Comments
- No comments yet. Be the first to comment.
Ready to put it into practice?
Open your account and practice on the demo account with US$10,000 in virtual funds, without risking money.
- Secure platformProtected login and identity verification
- Multilingual supportHelp available every day
- Free demo accountUS$10,000 virtual to practice
Trading involves the risk of losing the capital invested.
