

 Português pt
 Español es
 العربية ar
 বাংলা bn
 Deutsch de
 Filipino fil
 Français fr
 हिन्दी hi
 Bahasa Indonesia id
 Italiano it
 Русский ru
 Svenska sv
 ไทย th
 Türkçe tr
 Tiếng Việt vi
 简体中文 zh
Updated:
IndicatorsHistorical Volatility: What It Is, How to Calculate and Use It
 Naomi TanakaEditorial character · Analysis Desk

Quick answer
Historical volatility measures how much an asset's price has swung over a recent period: it's the standard deviation of daily returns, usually over 20 sessions, converted to an annual basis. It doesn't indicate direction, but it helps adjust the stop distance and the position size to the asset's actual behavior.
Knowing where price is going is impossible; knowing how much it usually moves is far more realistic. Historical volatility measures exactly that: the intensity of price swings over a recent period. It doesn't say whether the asset will rise or fall, but it helps decide position size, stop distance, and whether the market is calm or agitated.
In this guide we use real daily quotes for Tesla (TSLA) between April and October 2026, a stock known for swinging a lot, to show the calculation and what the indicator actually showed.
What historical volatility is
Historical volatility, often abbreviated HV, is the standard deviation of an asset's daily returns over a period, usually converted to an annual basis and expressed as a percentage. An HV of 30% means, statistically speaking, that the typical price swing over a year would be on the order of 30% up or down.
It's different from implied volatility, which is extracted from options prices and reflects the market's expectation for the future. Historical volatility only looks backward.

How to calculate historical volatility
- 1. Daily returns: for each day, calculate the logarithm of (today's close ÷ yesterday's close).
- 2. Standard deviation: calculate the standard deviation of those returns over the chosen period, usually 20 sessions (about a month).
- 3. Annualization: multiply by the square root of the number of trading sessions in a year, 252 for stocks, and by 100 to get the percentage.
Example with real Tesla data
Over the 20 sessions through October 7, 2026, Tesla's daily returns had a standard deviation of 1.885%. The square root of 252 is 15.87. So:
- 20-day HV = 1.885% × 15.87 = 29.9% annualized
- Typical one-day swing: 1.885% × $377.81 (October 7 close) = $7.12
- Typical one-week swing: 29.9% ÷ square root of 52 (7.21) = 4.1%
That was one of the period's lowest values. With 10 sessions, October 7's HV came to 36.3%; with 60 sessions, 50.8%. The same asset, on the same day, shows different volatilities depending on the window, which is why the choice of period matters.
Real example: Tesla's volatility in 2026
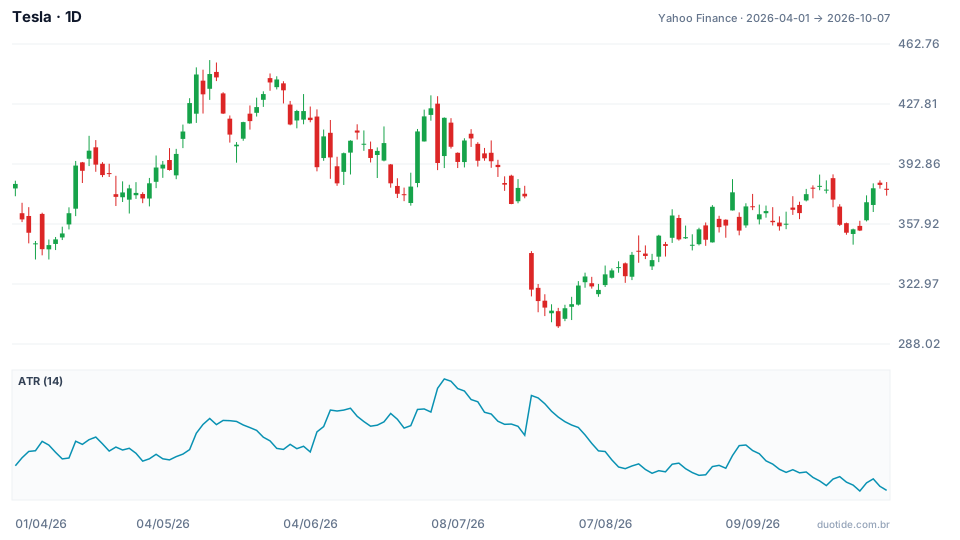
The chart shows Tesla's daily candles and, below, the 14-period ATR, which measures the average daily range in dollars and tracks along with historical volatility. The stock started the period at $381.26 and ended at $377.81, essentially flat (−0.9%), but the path included a high of $453.40 on May 13 and a low of $297.38 on July 29.
July: volatility spikes
In late June and early July the stock started making big jumps in both directions: +8.46% on June 29, −7.49% on July 2, and +6.69% on July 6. That day the ATR reached $20.32, the period's highest. On July 23 came a 14.52% drop in a single session, to $319.69. The next day the 20-day HV hit 79.5%, the period's peak.
Volatility changes more than price
Measured on the last session of each month, the 20-day HV was 43.7% in April, 38.9% in May, 56.4% in June, 68.7% in July, 40.7% in August, and 40.2% in September. On October 6 it reached 29.7%, the period's low, and the ATR on October 1 marked $11.82, also the lowest. The stock ended near where it started, but the way to trade it changed several times along the way.
What this means for position size
Suppose you accept risking $200 per trade and place the stop at 2 ATRs from the entry. On July 6, with the ATR at $20.32, the stop would sit $40.64 away and the position would be 200 ÷ 40.64 = 4.9, meaning 4 shares. On October 7, with the ATR at $11.87, the stop would sit $23.74 away, and the position, 200 ÷ 23.74 = 8.4, or 8 shares. The dollar risk is the same; the quantity doubled because the ATR fell 42%.

How to set up and use historical volatility
Choosing the period
Ten sessions react fast but swing a lot; 20 sessions (a month) is the most common default; 60 sessions (a quarter) show the underlying volatility regime. Using two windows at once, like 20 and 60, helps you notice when short-term volatility is above or below normal.
Adjusting stops and position sizes
Fixed percentage stops ignore the asset's behavior. A 2% stop on Tesla in July would have been hit by a single day's normal swing. Adjusting the stop and the position size to volatility keeps the risk constant.
Reading the regime
Very low volatility for a long time usually precedes stronger moves, and extreme volatility usually reverts to the mean over time. These are statistical tendencies, not rules: they don't say when or in which direction price will go.
Limitations
HV is calculated from the past and reacts after the event: the 79.5% peak came one day after the 14.52% drop. It treats rallies and drops the same way and assumes returns are distributed evenly, which doesn't happen on news days. Values from different assets are only comparable if they use the same period and the same annualization.
Common mistakes when using historical volatility
- Thinking high volatility signals a drop: it measures intensity, not direction.
- Using the same percentage stop on assets and moments with very different volatility.
- Comparing HV calculated with different windows (10, 20, or 60 sessions) as if they were equal.
- Annualizing stocks with 365 days, when they have about 252 trading sessions a year (for crypto, which trades every day, 365 is used).
- Forgetting that Tesla's numbers describe what happened, not what will happen.
To practice, pick two assets on a demo account, one calm and one agitated, follow the 20- and 60-session historical volatility for a few weeks, and calculate each position's size from a fixed dollar risk. Log the results and compare them with what would have happened using the same percentage stop every time.
Practice before you risk. Open your Duotide account and test your ideas on the demo account with US$10,000 in virtual funds.
Create free accountUpdated:
Editorial character of the Duotide newsroom. Articles are written by the team with the help of artificial intelligence; prices and charts come from real market data. Explains charts, indicators and trading strategies: how they work, where they fail and how to test them first.
Was this article helpful?
Be the first to rate it.
Comments
- No comments yet. Be the first to comment.
Ready to put it into practice?
Open your account and practice on the demo account with US$10,000 in virtual funds, without risking money.
- Secure platformProtected login and identity verification
- Multilingual supportHelp available every day
- Free demo accountUS$10,000 virtual to practice
Trading involves the risk of losing the capital invested.
