

 Português pt
 Español es
 العربية ar
 বাংলা bn
 Deutsch de
 Filipino fil
 Français fr
 हिन्दी hi
 Bahasa Indonesia id
 Italiano it
 Русский ru
 Svenska sv
 ไทย th
 Türkçe tr
 Tiếng Việt vi
 简体中文 zh
Updated:
StrategiesHow to Backtest a Strategy Before Trading for Real
 Naomi TanakaEditorial character · Analysis Desk

Quick answer
To backtest a strategy, write clear entry and exit rules, apply them to several years of historical data without skipping signals, and log every trade. Then calculate the win rate, the average gain and loss, and the mathematical expectancy. The result shows how the rule behaved in the past; it doesn't guarantee the future.
Before putting money into a strategy, you can find out how it would have performed in the past. That's a backtest: applying fixed rules to historical data and logging every trade they would have generated. It guarantees nothing about the future, but it quickly rules out ideas that didn't even work in the past, and it shows the size of the losses you'll need to survive.
In this guide, we run a full backtest of a simple rule, the 20- and 50-day moving average crossover, over five years of real daily S&P 500 closes (from Yahoo Finance, October 2021 through October 2026).
What a backtest is
It's a simulation. You define the entry, exit, and stop rules so they leave no room for interpretation, walk through the history candle by candle as if you didn't know what comes next, and log the result of every trade. It can be done by hand, scrolling through the chart, or with a spreadsheet or a program.

How to run the backtest, step by step
1. Write the rules
In our example: buy at the close of the day the 20-day simple moving average crosses above the 50-day; sell at the close of the day it crosses below. Only long trades, no leverage.
2. Choose a long, varied period
The period needs to include rallies, drops, and sideways stretches. Five years of the S&P 500 include the 2022 drop and the 2023-to-2026 rallies.
3. Log every trade
Entry date and price, exit date and price, and the result in percentage. No skipping signals that "clearly weren't going to work."
4. Calculate the statistics
Win rate, average gain, average loss, biggest loss, longest losing streak, and the mathematical expectancy:
Expectancy = (win rate × average gain) − (loss rate × average loss)
It tells you how much, on average, each trade returned. If it's negative, the strategy lost money in the historical sample, no matter how good some individual trades might look.
Real example: the backtest on the S&P 500
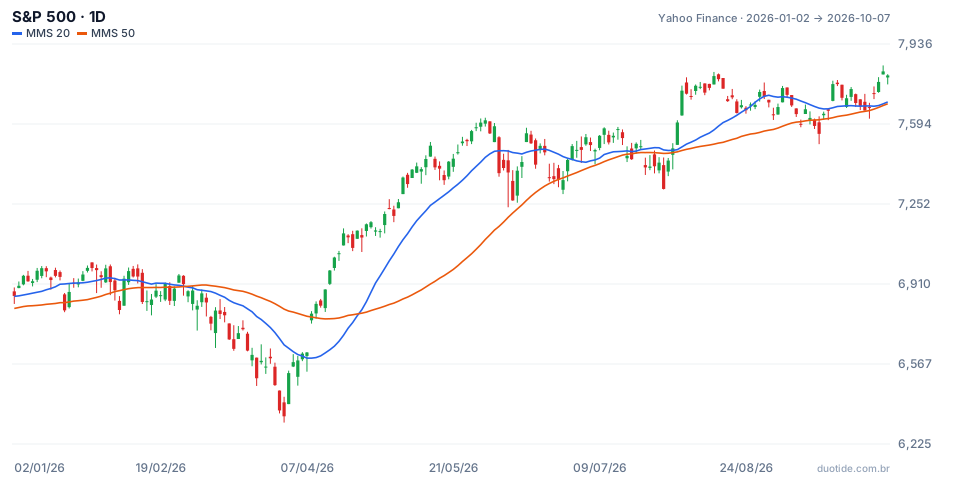
The chart shows the 2026 stretch, with the 20-day average in blue and the 50-day in orange. It shows the last two signals: the bearish crossover on February 27, 2026, which closed a trade opened on May 14, 2025, and the bullish crossover on April 23, 2026, with the index at 7,108.40 points, which opened the trade still running.
The trades
Over five years, the rule generated 10 closed trades and one open one. A few of them:
- April 4, 2022, to May 2, 2022: from 4,582.64 to 4,155.38 points, −9.32%, the biggest loss.
- August 1, 2022, to September 16, 2022: −5.96%. November 11, 2022, to January 3, 2023: −4.23%. January 30, 2023, to March 14, 2023: −2.45%.
- April 13, 2023, to August 25, 2023: +6.26%. November 20, 2023, to April 26, 2024: +12.15%.
- May 20, 2024, to August 9, 2024: +0.68%. September 4, 2024, to January 13, 2025: +5.73%. February 6, 2025, to March 7, 2025: −5.15%.
- May 14, 2025, to February 27, 2026: from 5,892.58 to 6,878.88 points, +16.74%, the biggest gain.
- Open since April 23, 2026: on October 7, 2026, the index stood at 7,801.77 points, +9.75%.
The statistics
Of the 10 closed trades, 5 won and 5 lost, a 50% win rate. The average gain was 8.31% and the average loss, 5.42%. The expectancy works out to:
(0.50 × 8.31) − (0.50 × 5.42) = 4.16 − 2.71 = +1.45% per trade.
Reinvesting each trade's result into the next, the 10 closed trades added up to +11.9%; with the open trade, +22.81% through October 7, 2026. Over the same period, anyone who simply bought the index on October 8, 2021 (4,391.34 points) and held through October 7, 2026, would have +77.66%. The rule spent a good part of the time out of the market, which is why it lost to simple buy and hold. That's a conclusion only the backtest reveals.
Splitting the period in half
Splitting by entry date, the 6 trades opened through 2023 had 2 wins and 4 losses, with an expectancy of −0.59% per trade. The 4 opened from 2024 onward had 3 wins and 1 loss, with an expectancy of +4.5%. The same rule lost in one phase and won in the other, and it started with four straight losses. Anyone following it since April 2022 would have gone through almost a year of nothing but losing trades before the first win. These results describe the past, not what will happen.

How to use the backtest's result
Look at the sample size
Ten trades is too few. With small samples, a single large trade, like 2025's +16.74%, changes the entire statistic. Look for dozens or hundreds of trades, testing the rule on other assets or timeframes.
Test out of sample
Tune the rule on one part of the data and confirm it on another part you didn't use. If the result is only good on the stretch you tuned on, the rule was molded to the past.
Include costs
The numbers above don't include fees, spread, or the gap between the signal's price and the executed price. On strategies with many trades, that can wipe out the expectancy.
Limitations
The backtest assumes perfect execution and doesn't feel the pressure of four straight losses with real money. The index also isn't directly tradable: in practice, the trade would go through an ETF or a contract, with costs and small price differences.
Common mistakes when backtesting
- Testing over a short period, or one with only a rally.
- Changing the rules mid-test after seeing the result.
- Tuning parameters until the result looks perfect in the past.
- Ignoring costs, spread, and execution differences.
- Not comparing against a simple benchmark, like buying and holding the asset itself.
To practice without risking money, write down a strategy's rules, backtest it in a spreadsheet with a few years of data, and then trade the same rule on a demo account for a few weeks, logging every trade. Comparing the demo's result with the backtest's shows how much of the history repeats in practice.
Practice before you risk. Open your Duotide account and test your ideas on the demo account with US$10,000 in virtual funds.
Create free accountUpdated:
Editorial character of the Duotide newsroom. Articles are written by the team with the help of artificial intelligence; prices and charts come from real market data. Explains charts, indicators and trading strategies: how they work, where they fail and how to test them first.
Was this article helpful?
Be the first to rate it.
Comments
- No comments yet. Be the first to comment.
Ready to put it into practice?
Open your account and practice on the demo account with US$10,000 in virtual funds, without risking money.
- Secure platformProtected login and identity verification
- Multilingual supportHelp available every day
- Free demo accountUS$10,000 virtual to practice
Trading involves the risk of losing the capital invested.
